The viewer
2D Mode
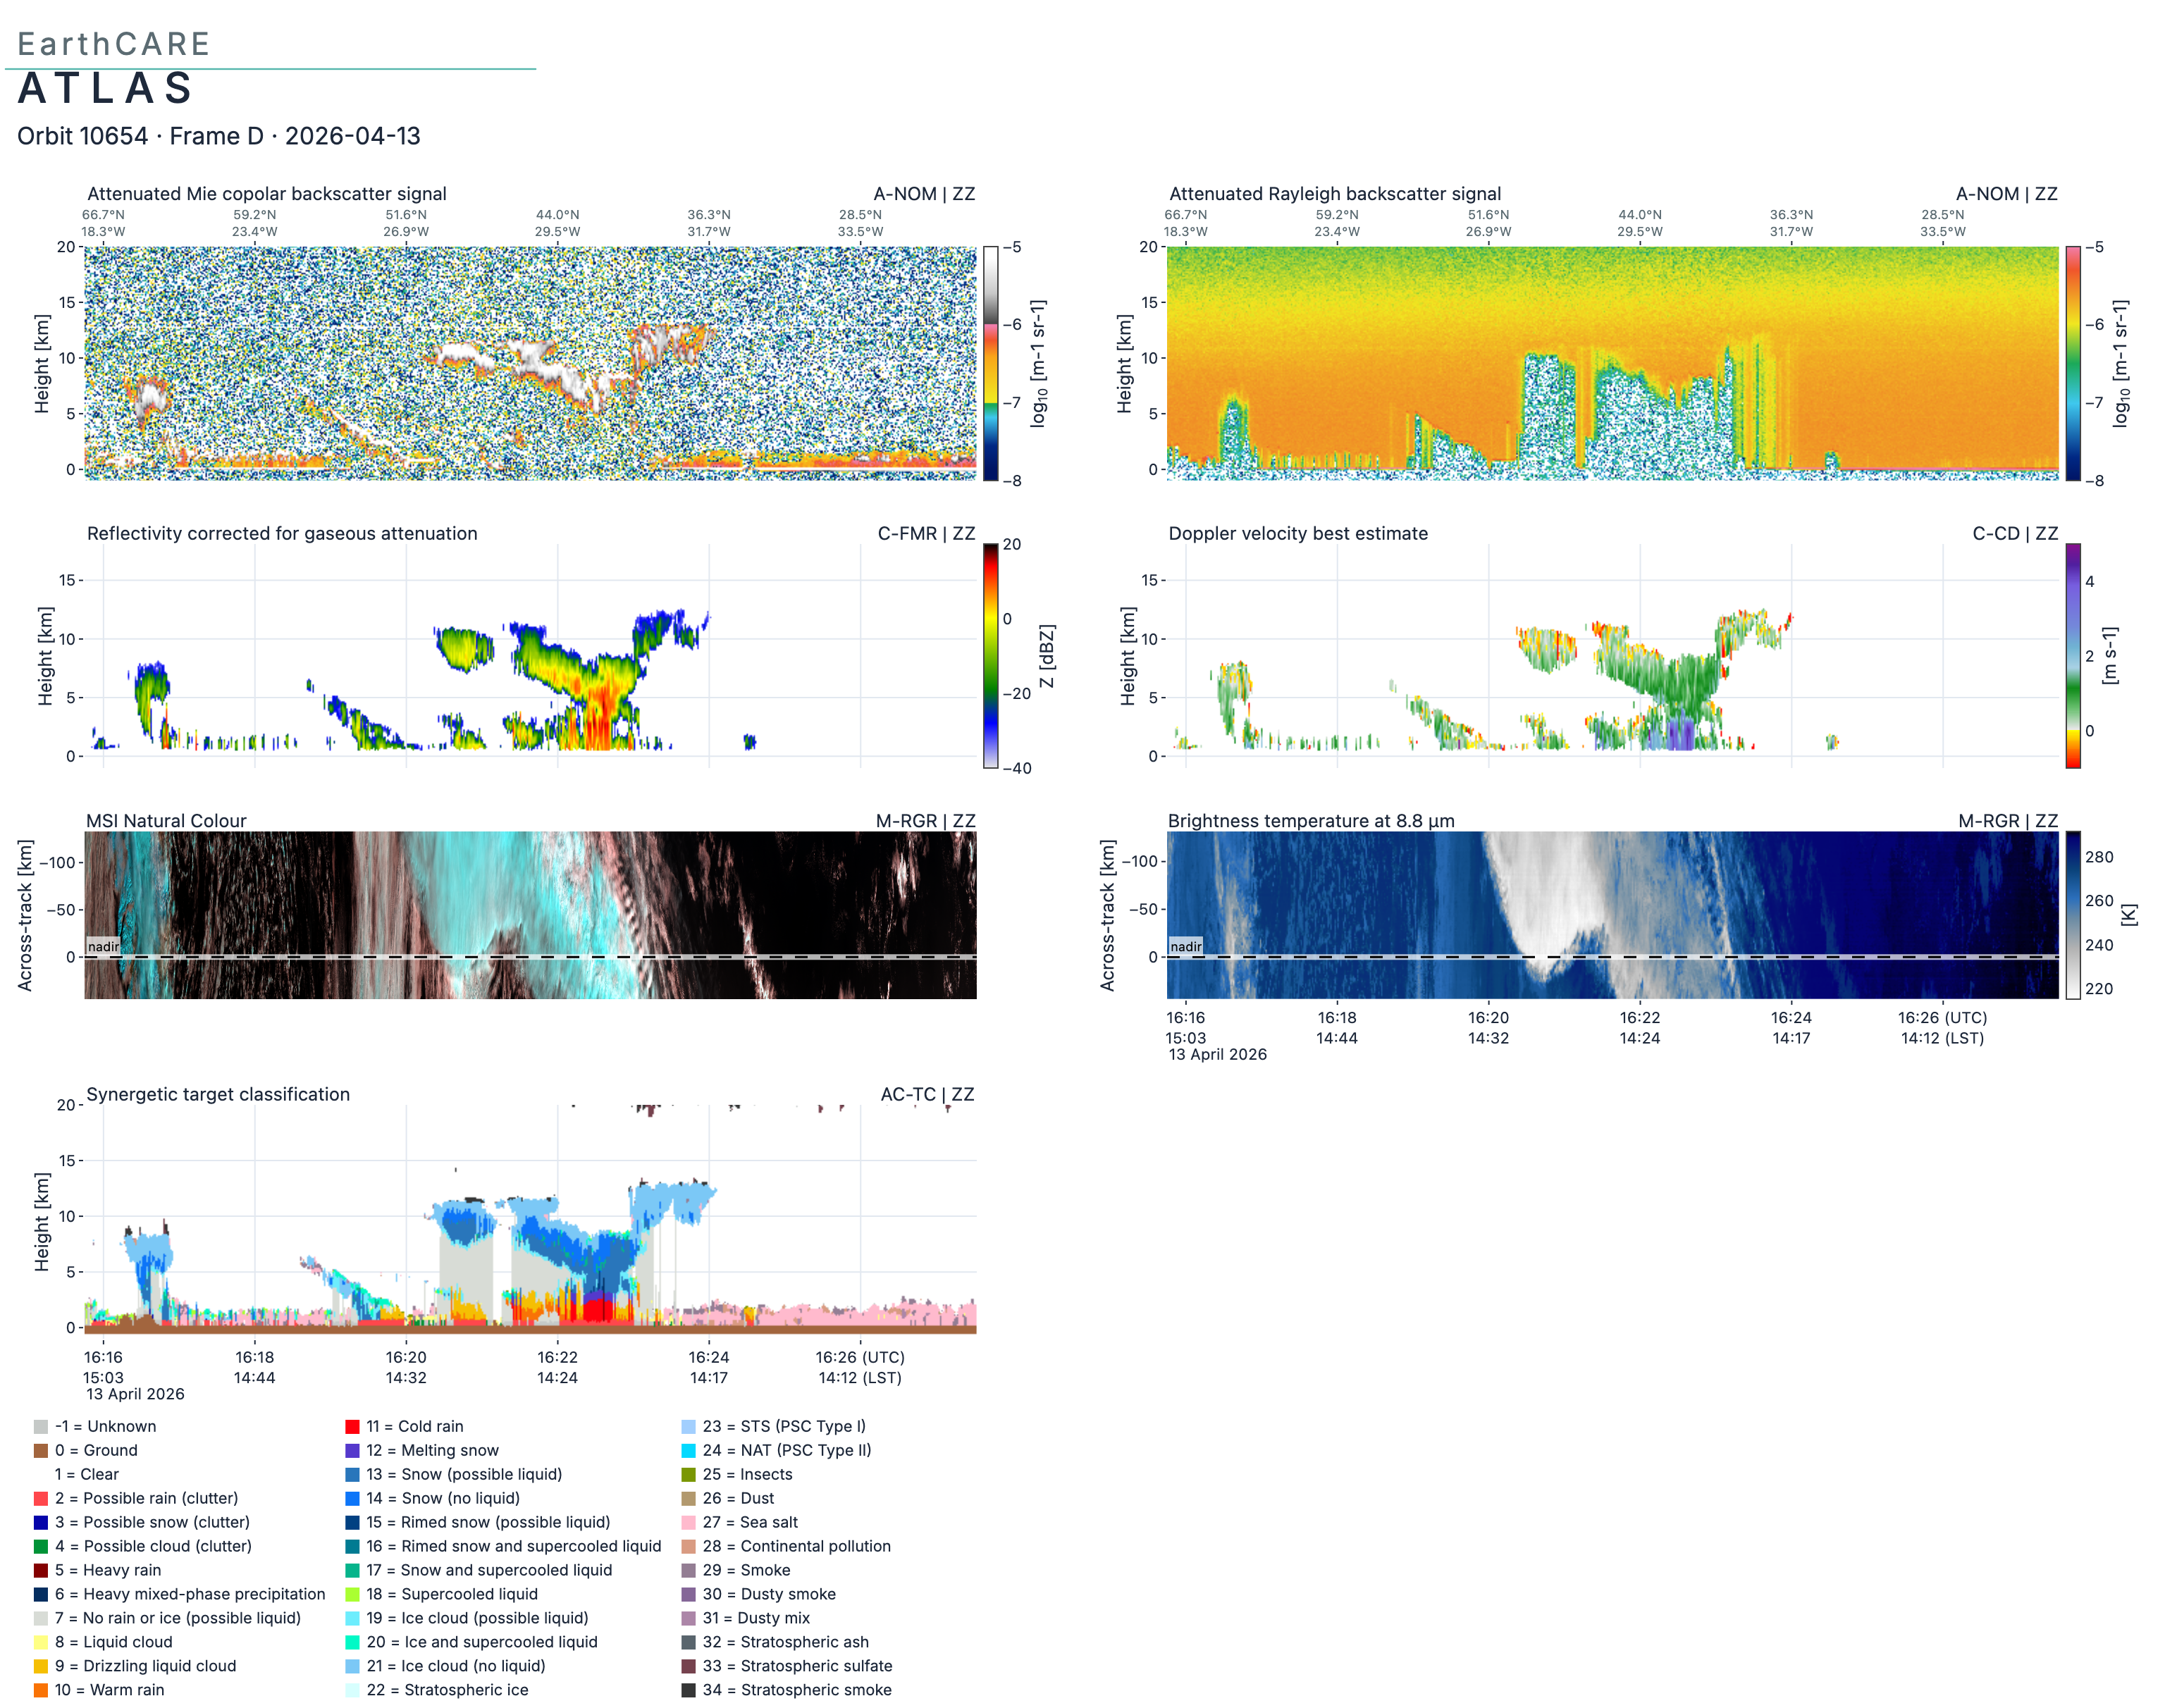
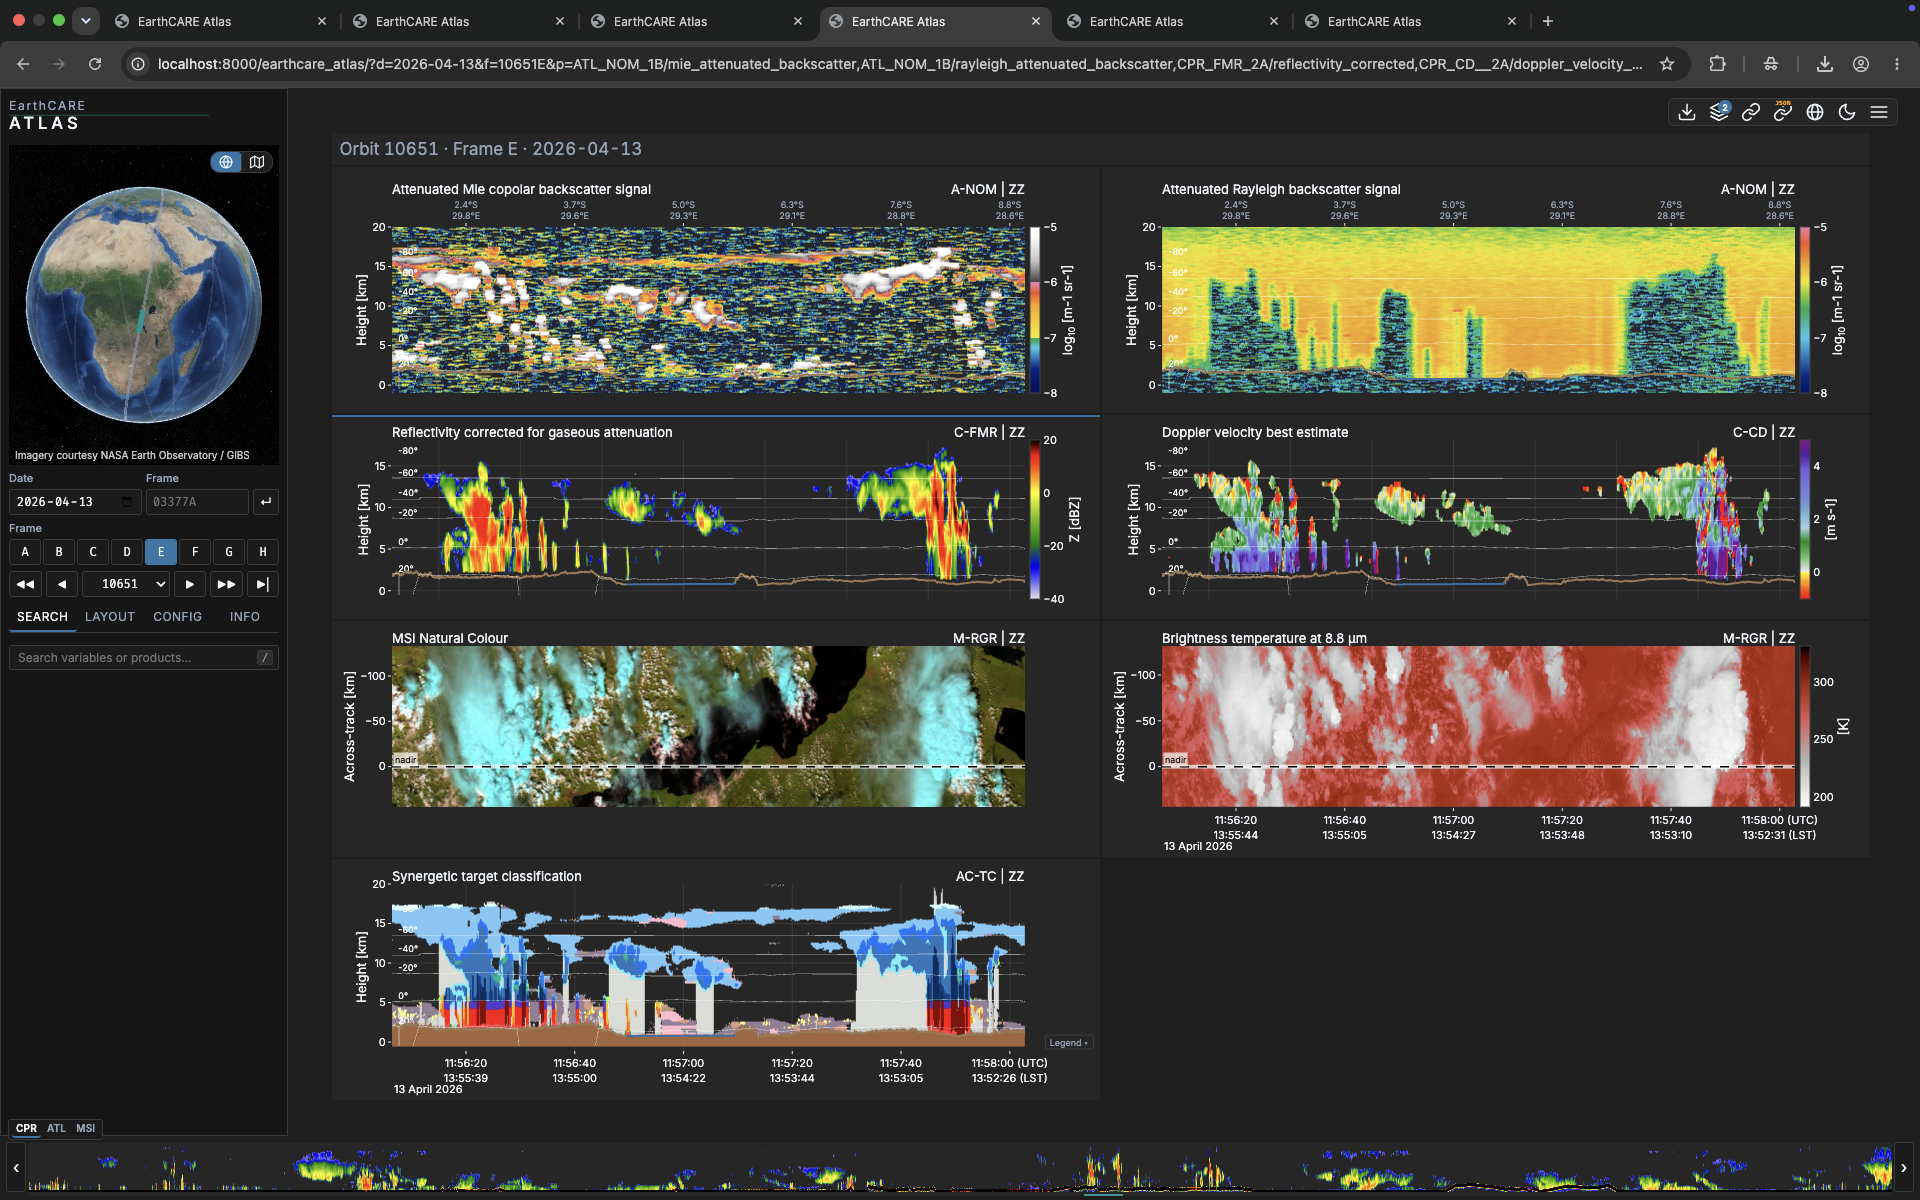
Synchronized curtain plots of every retrieved variable along the orbit — pan, zoom and compare dozens of panels at once.
 ↑ Top
↑ Top
The viewer
3D Mode
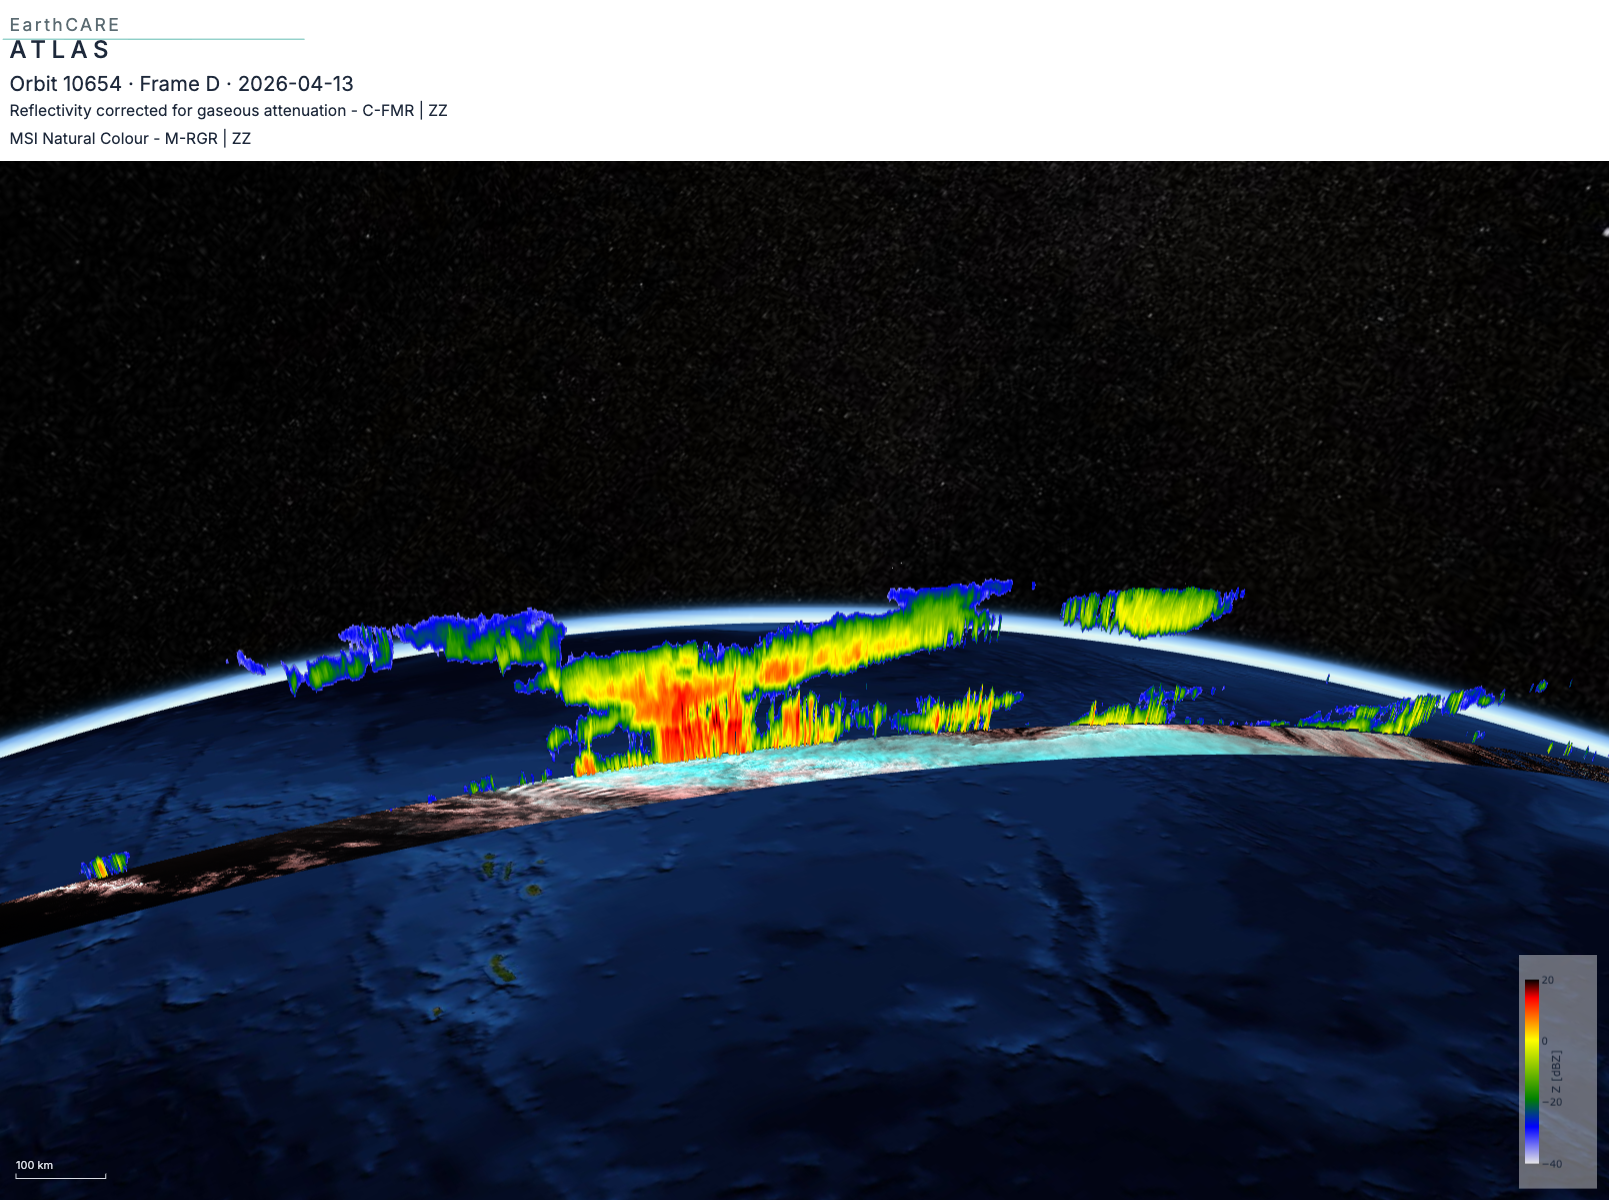
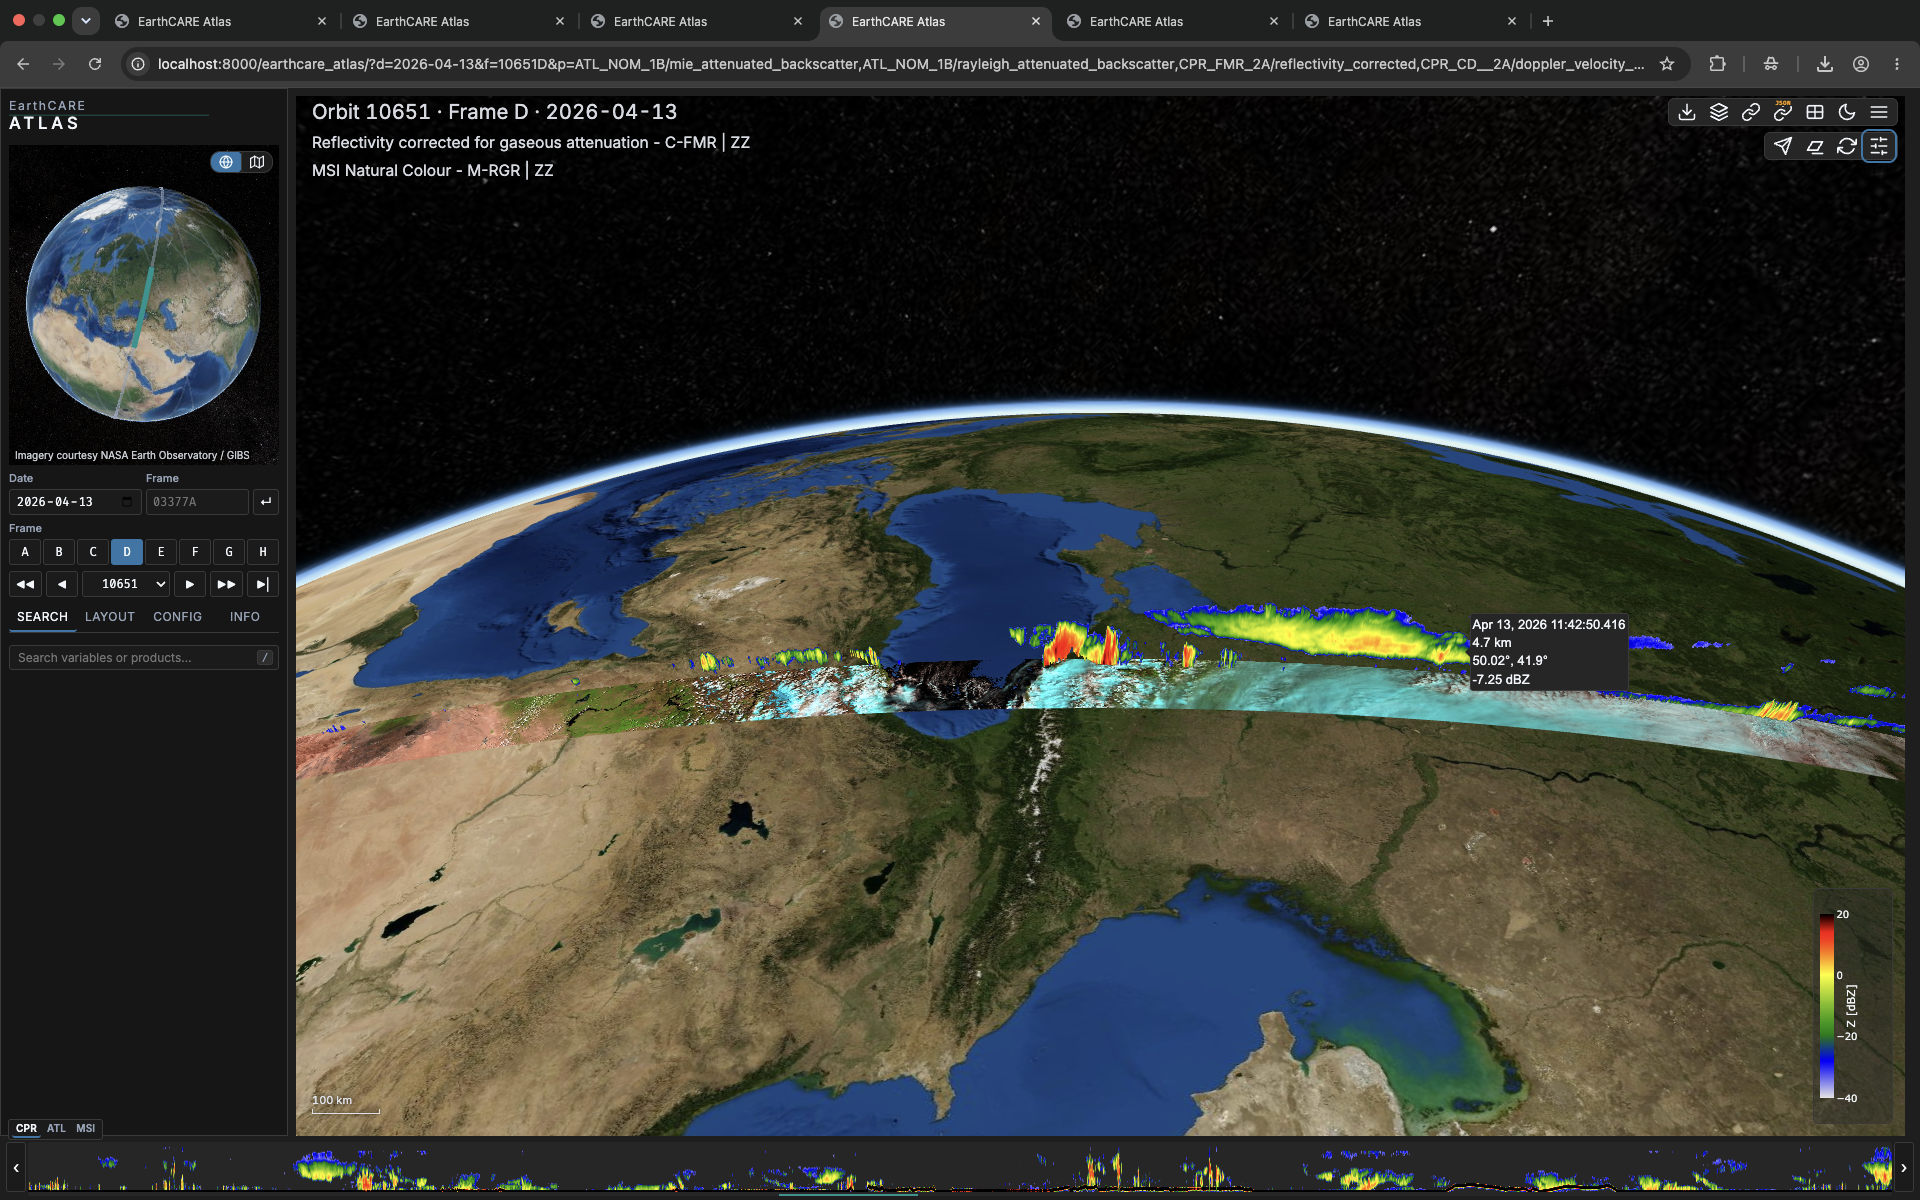
The same curtain draped through a navigable globe — see where in the atmosphere each profile was measured.
 ↑ Top
↑ Top
Phenomena
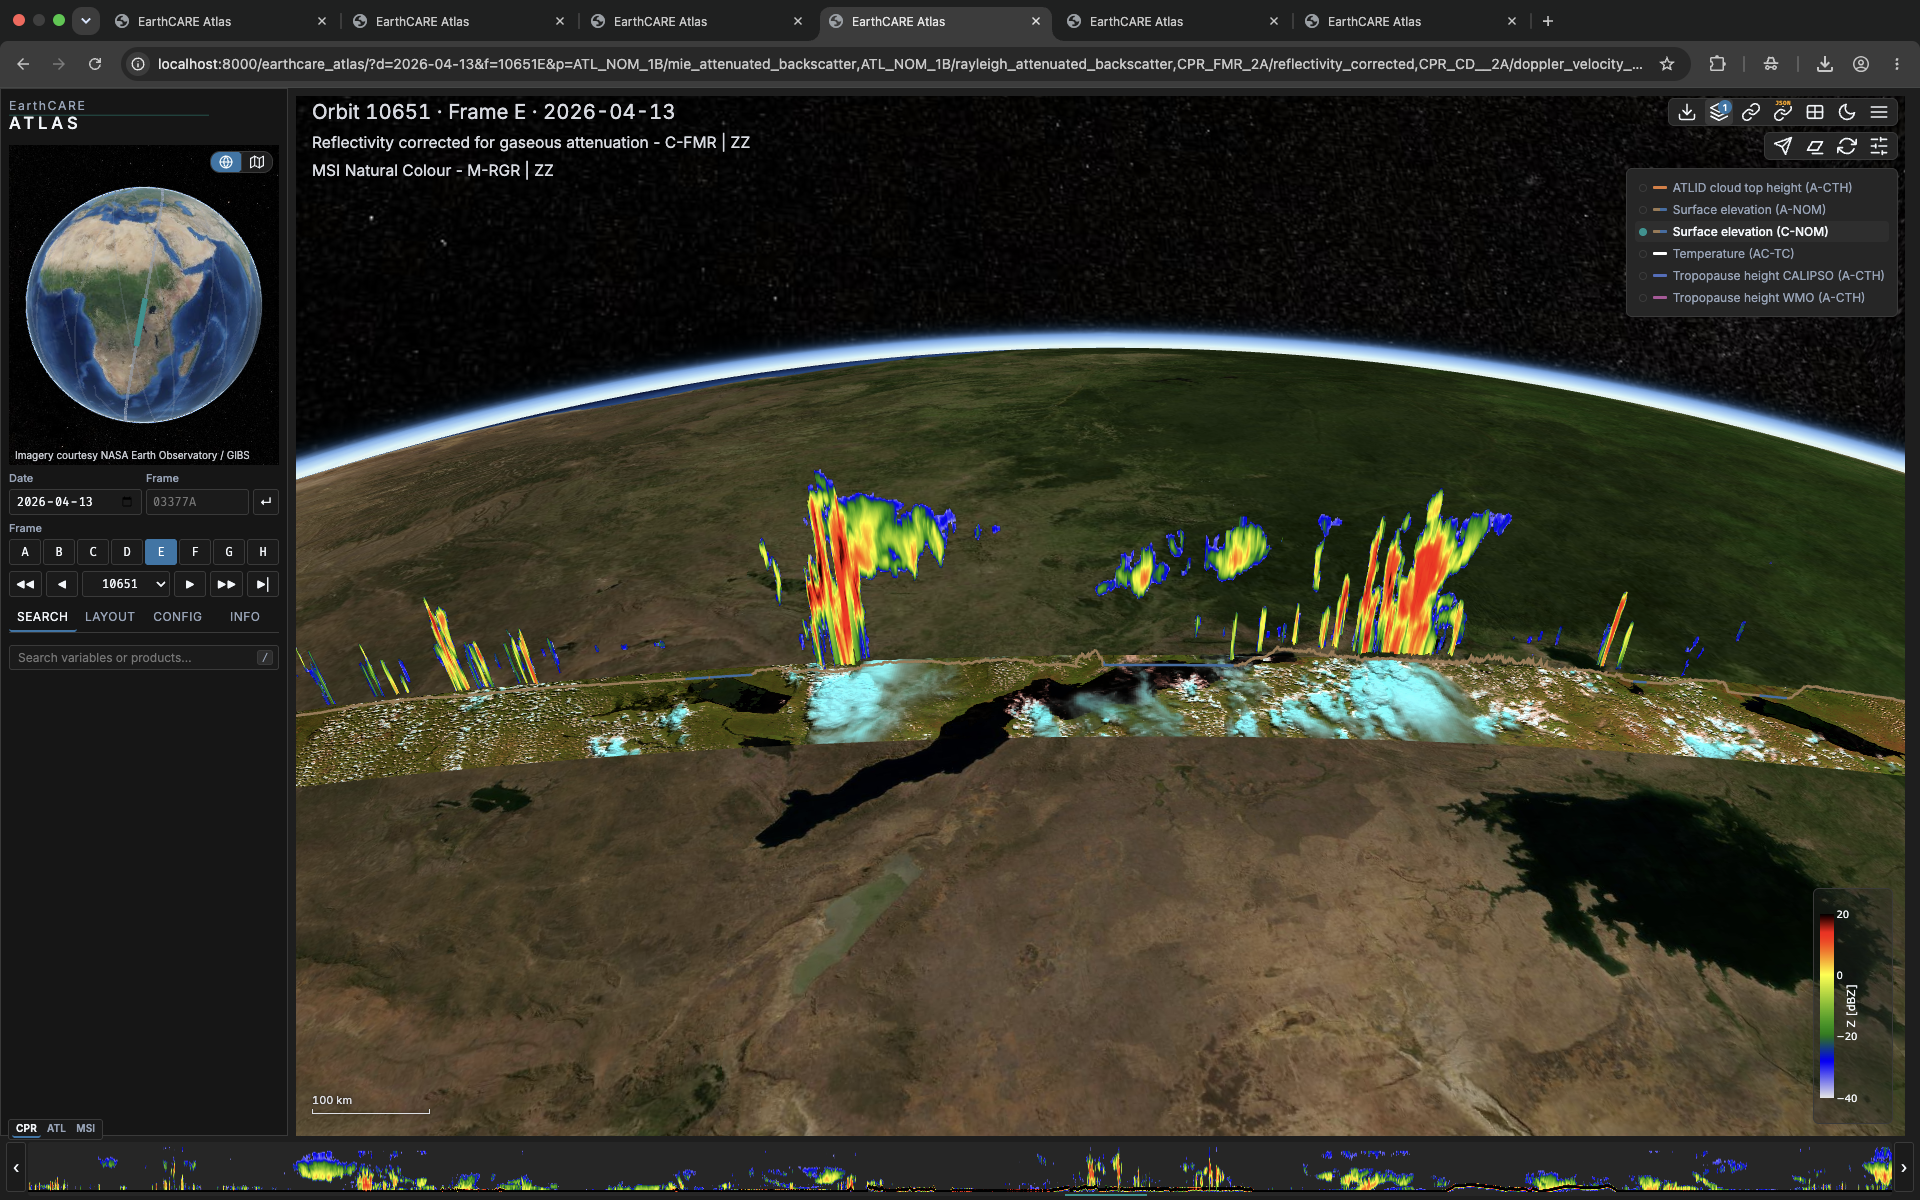
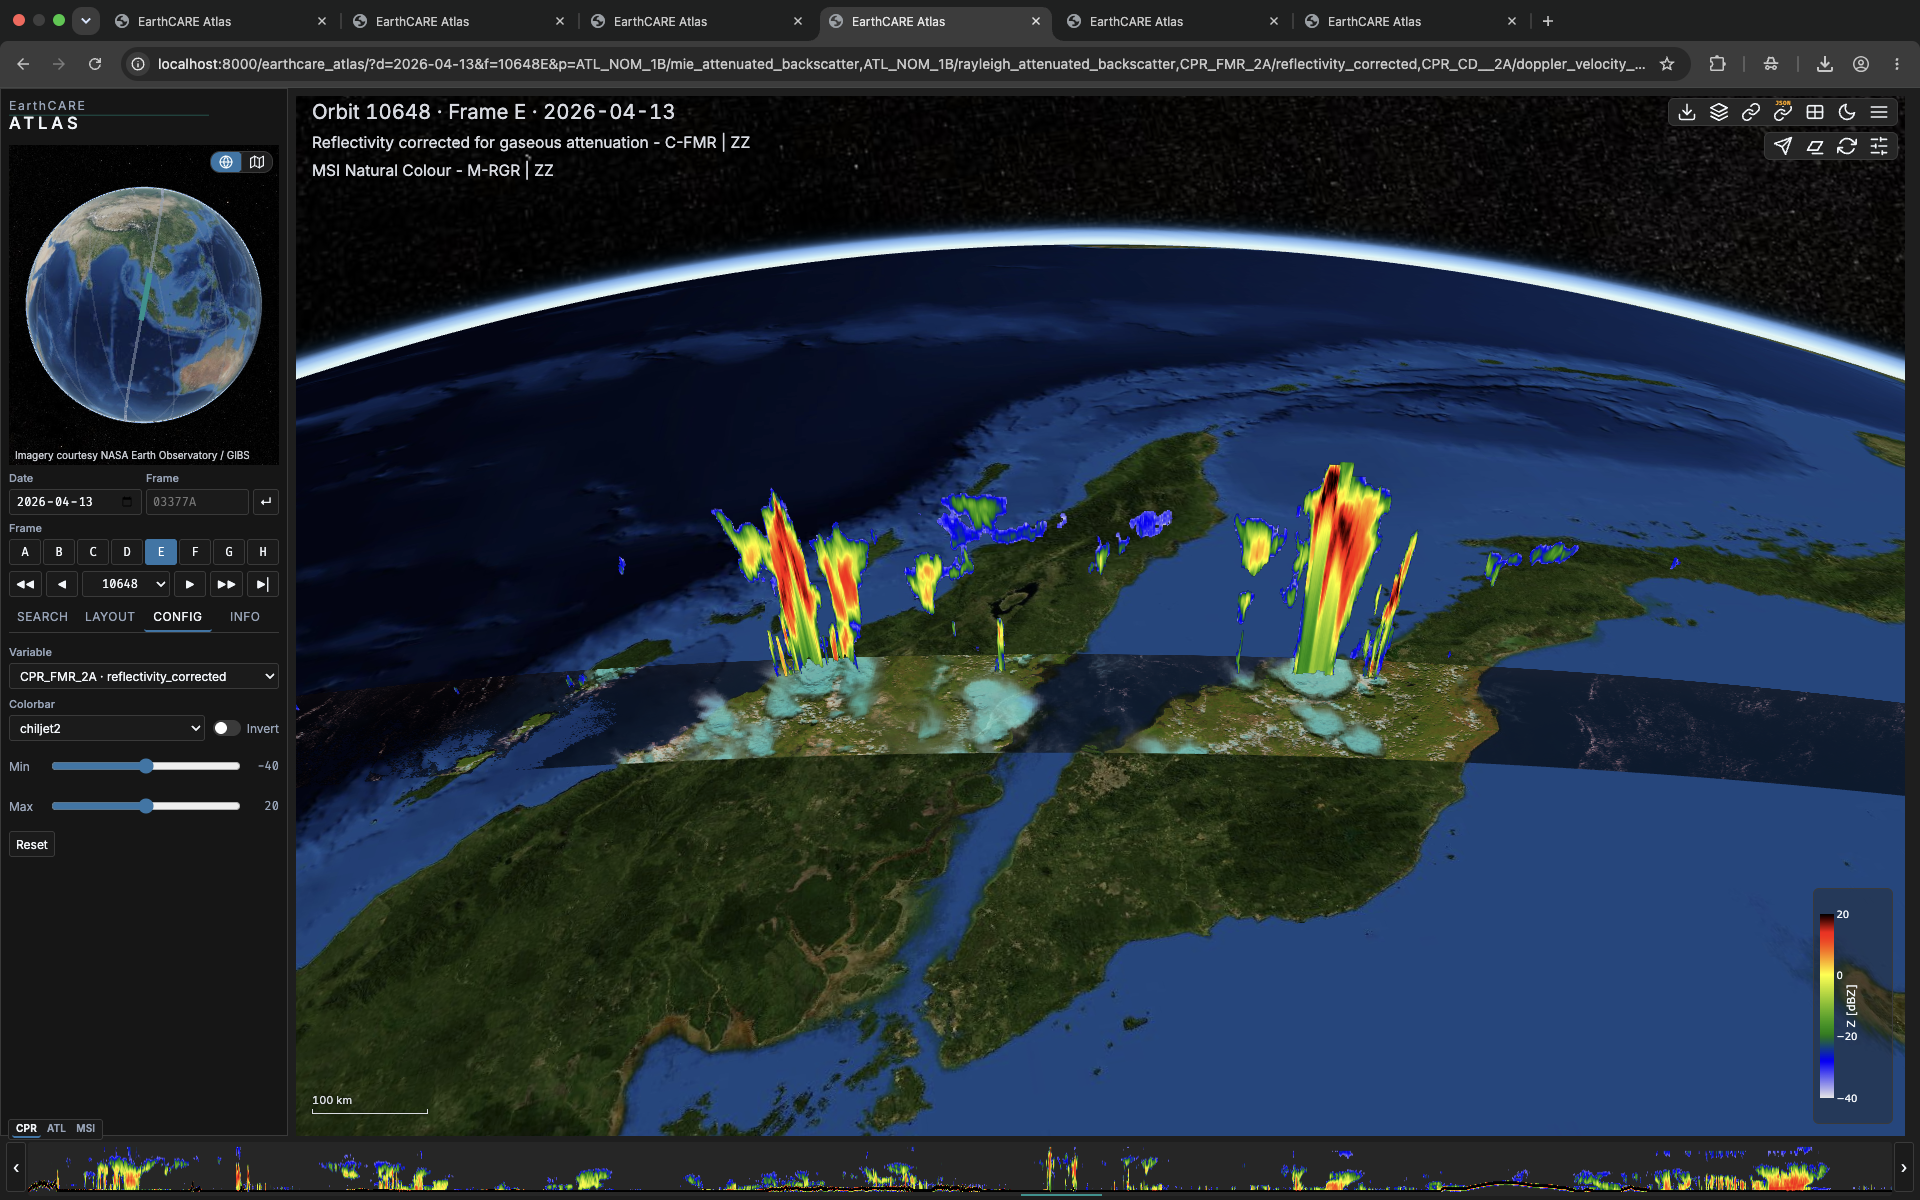
Convection
Deep convective towers resolved from anvil top to precipitating core.
Phenomena
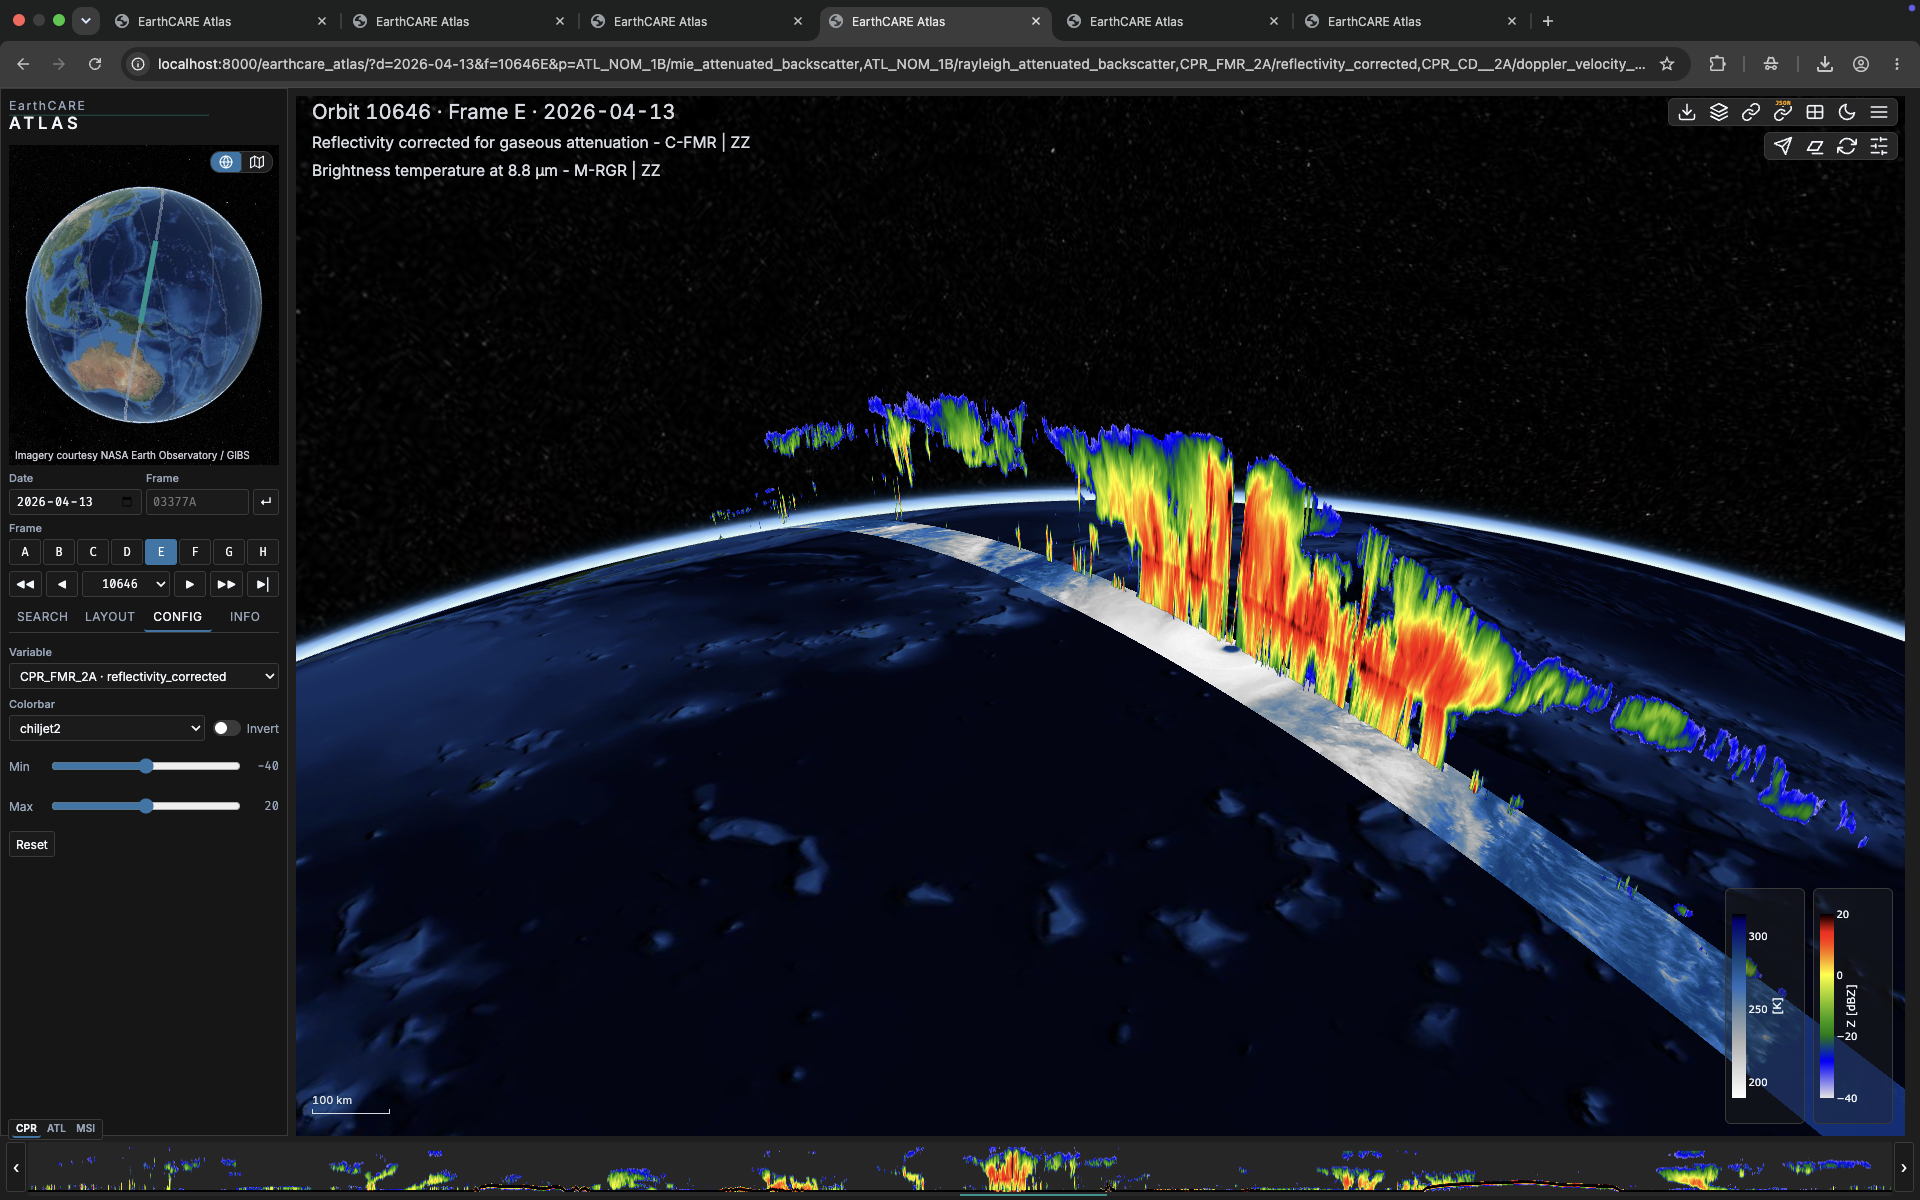
Typhoon Sinlaku
A slice straight through a tropical cyclone — eye, eyewall and outflow in one curtain.
 ↑ Top
↑ Top
Phenomena
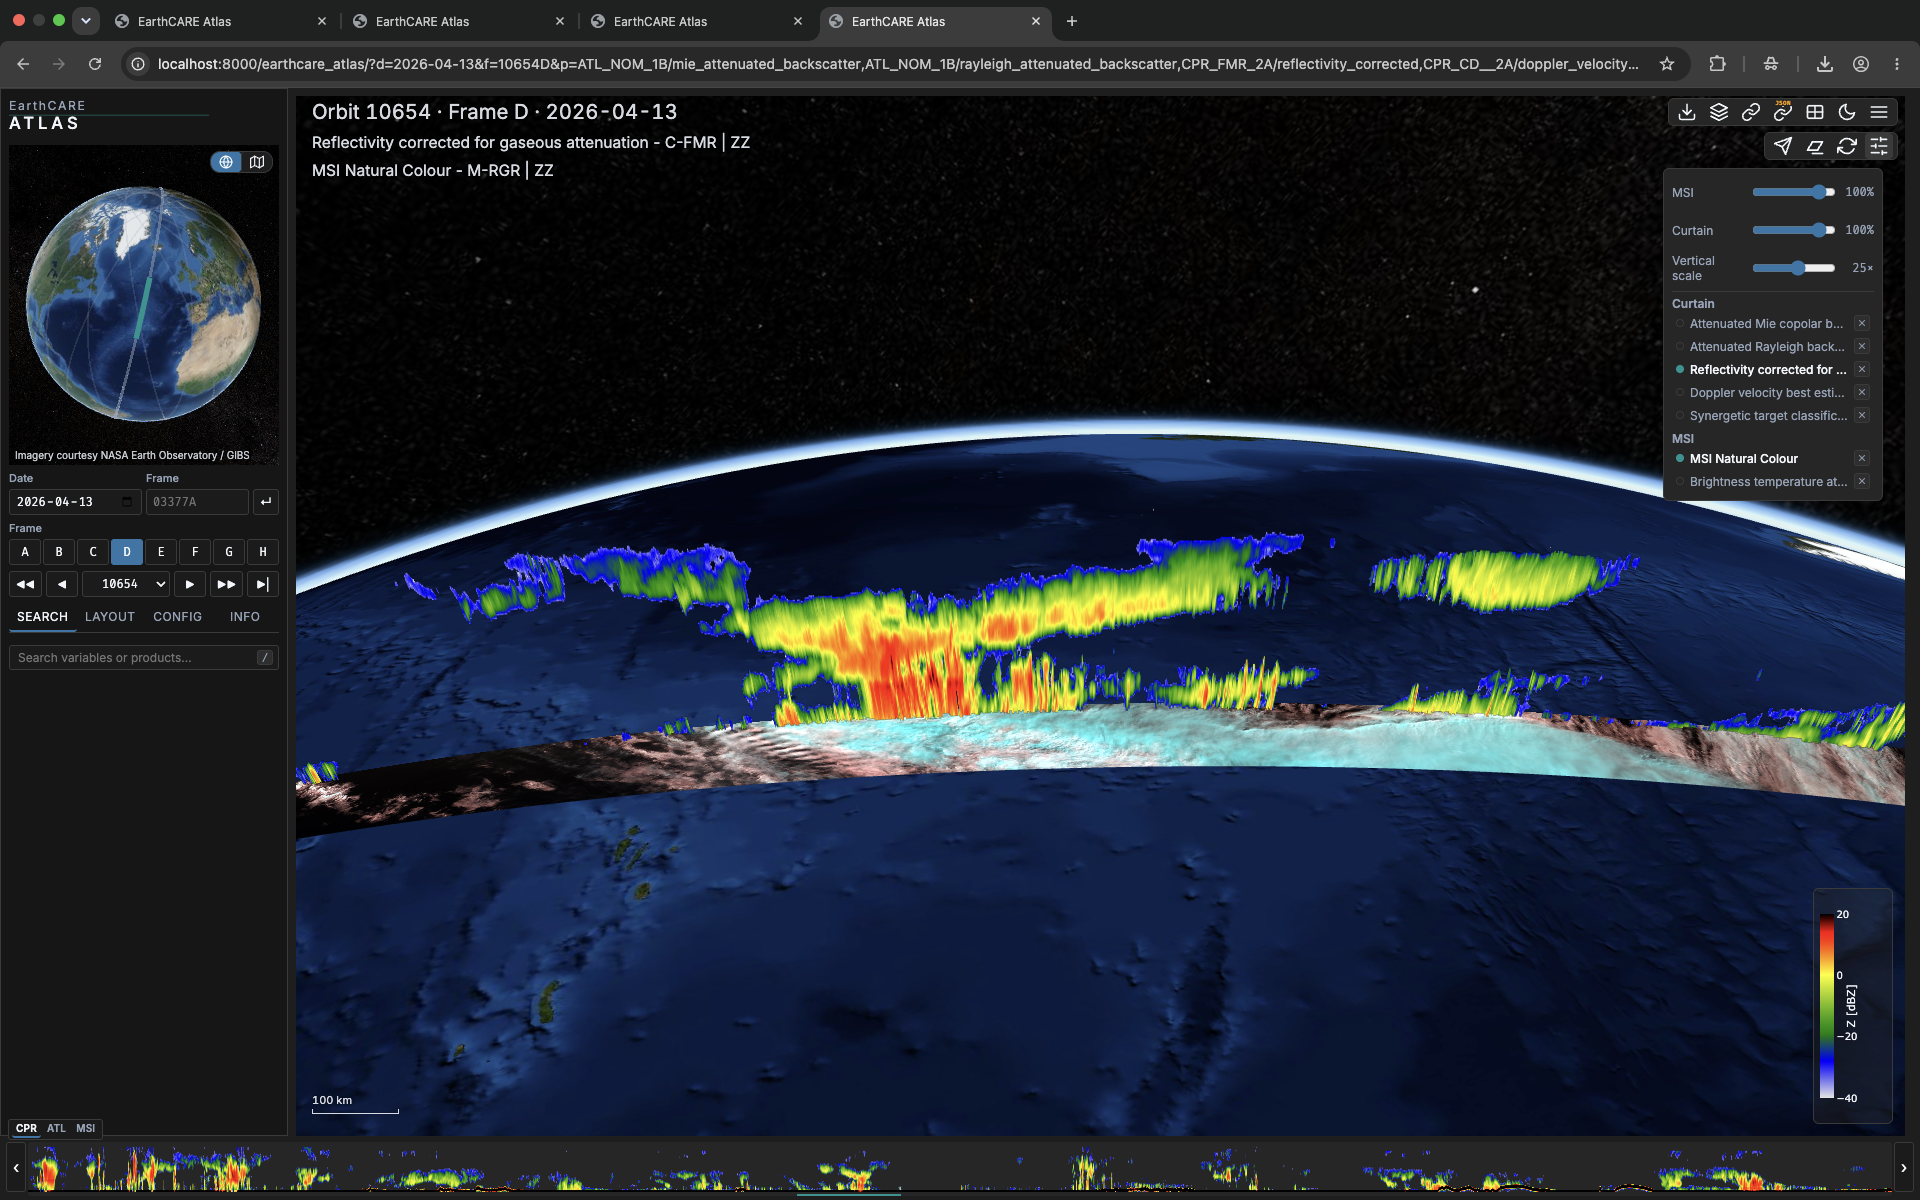
Mid-Latitude Cyclone
A frontal system in cross-section — cloud bands, conveyor belts and precipitation across the storm track.
 ↑ Top
↑ Top
Phenomena
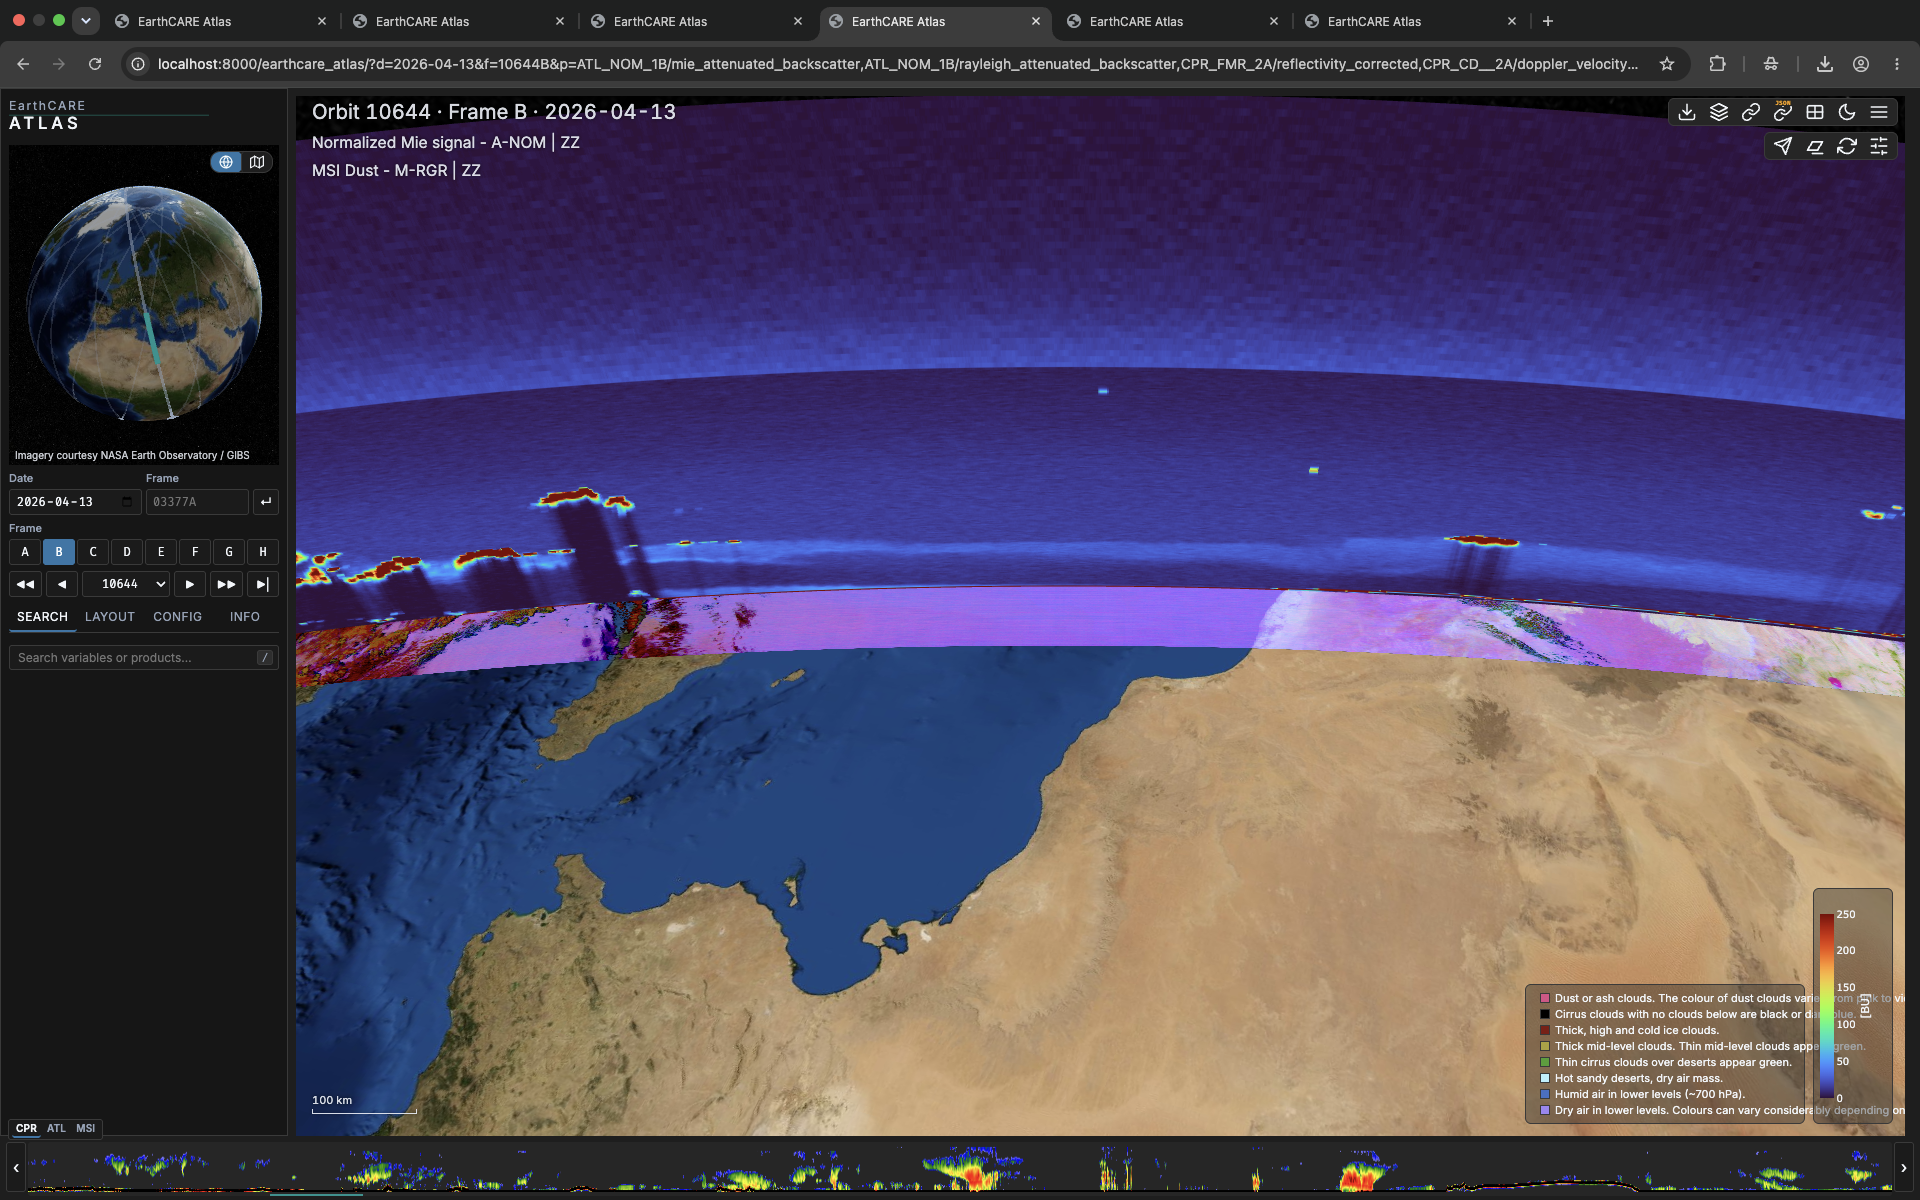
Dust Storm
Elevated dust layers traced by the atmospheric lidar across thousands of kilometres.
 ↑ Top
↑ Top
Phenomena
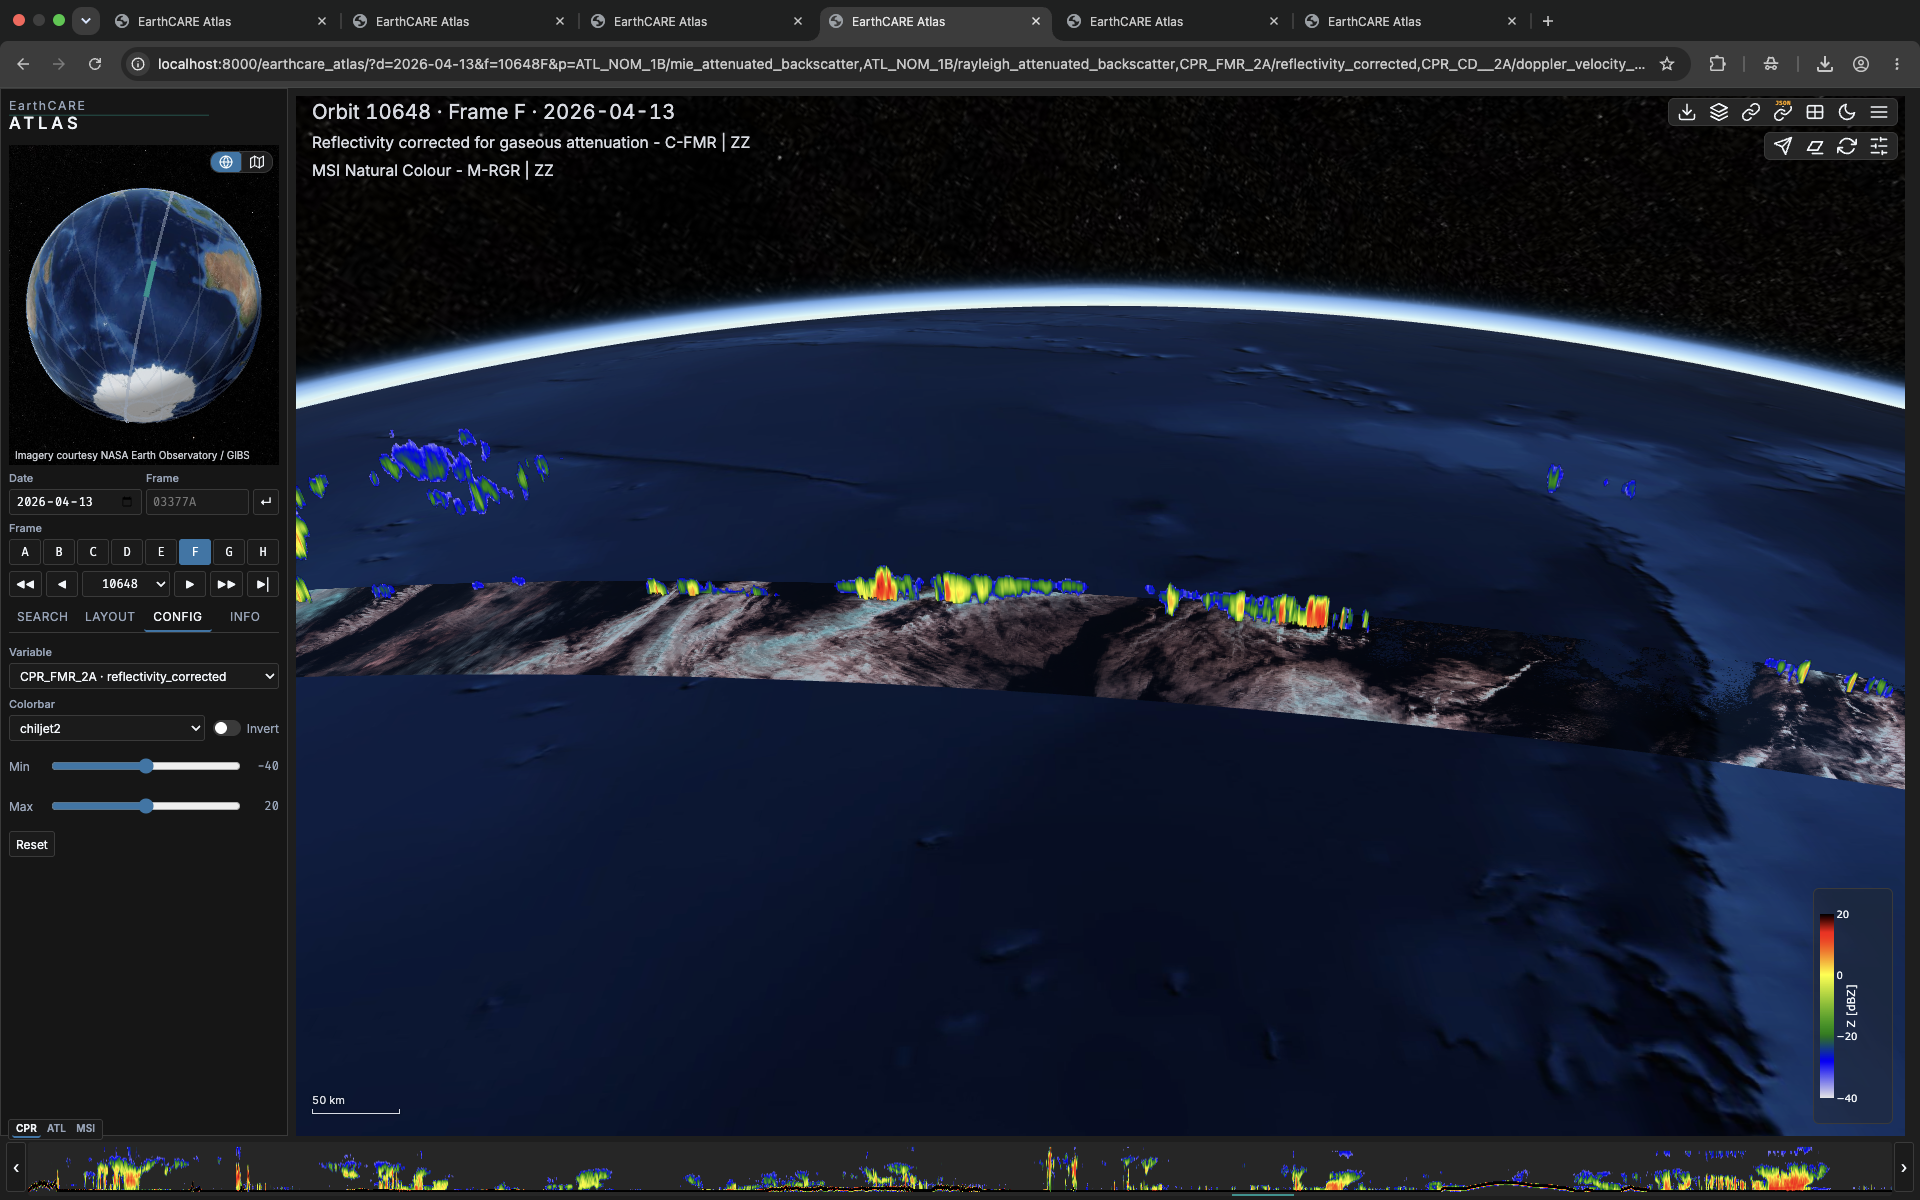
Marine Shallow Clouds
Warm boundary-layer clouds and drizzle, captured at the radar's finest sensitivity.
 ↑ Top
↑ Top
Phenomena
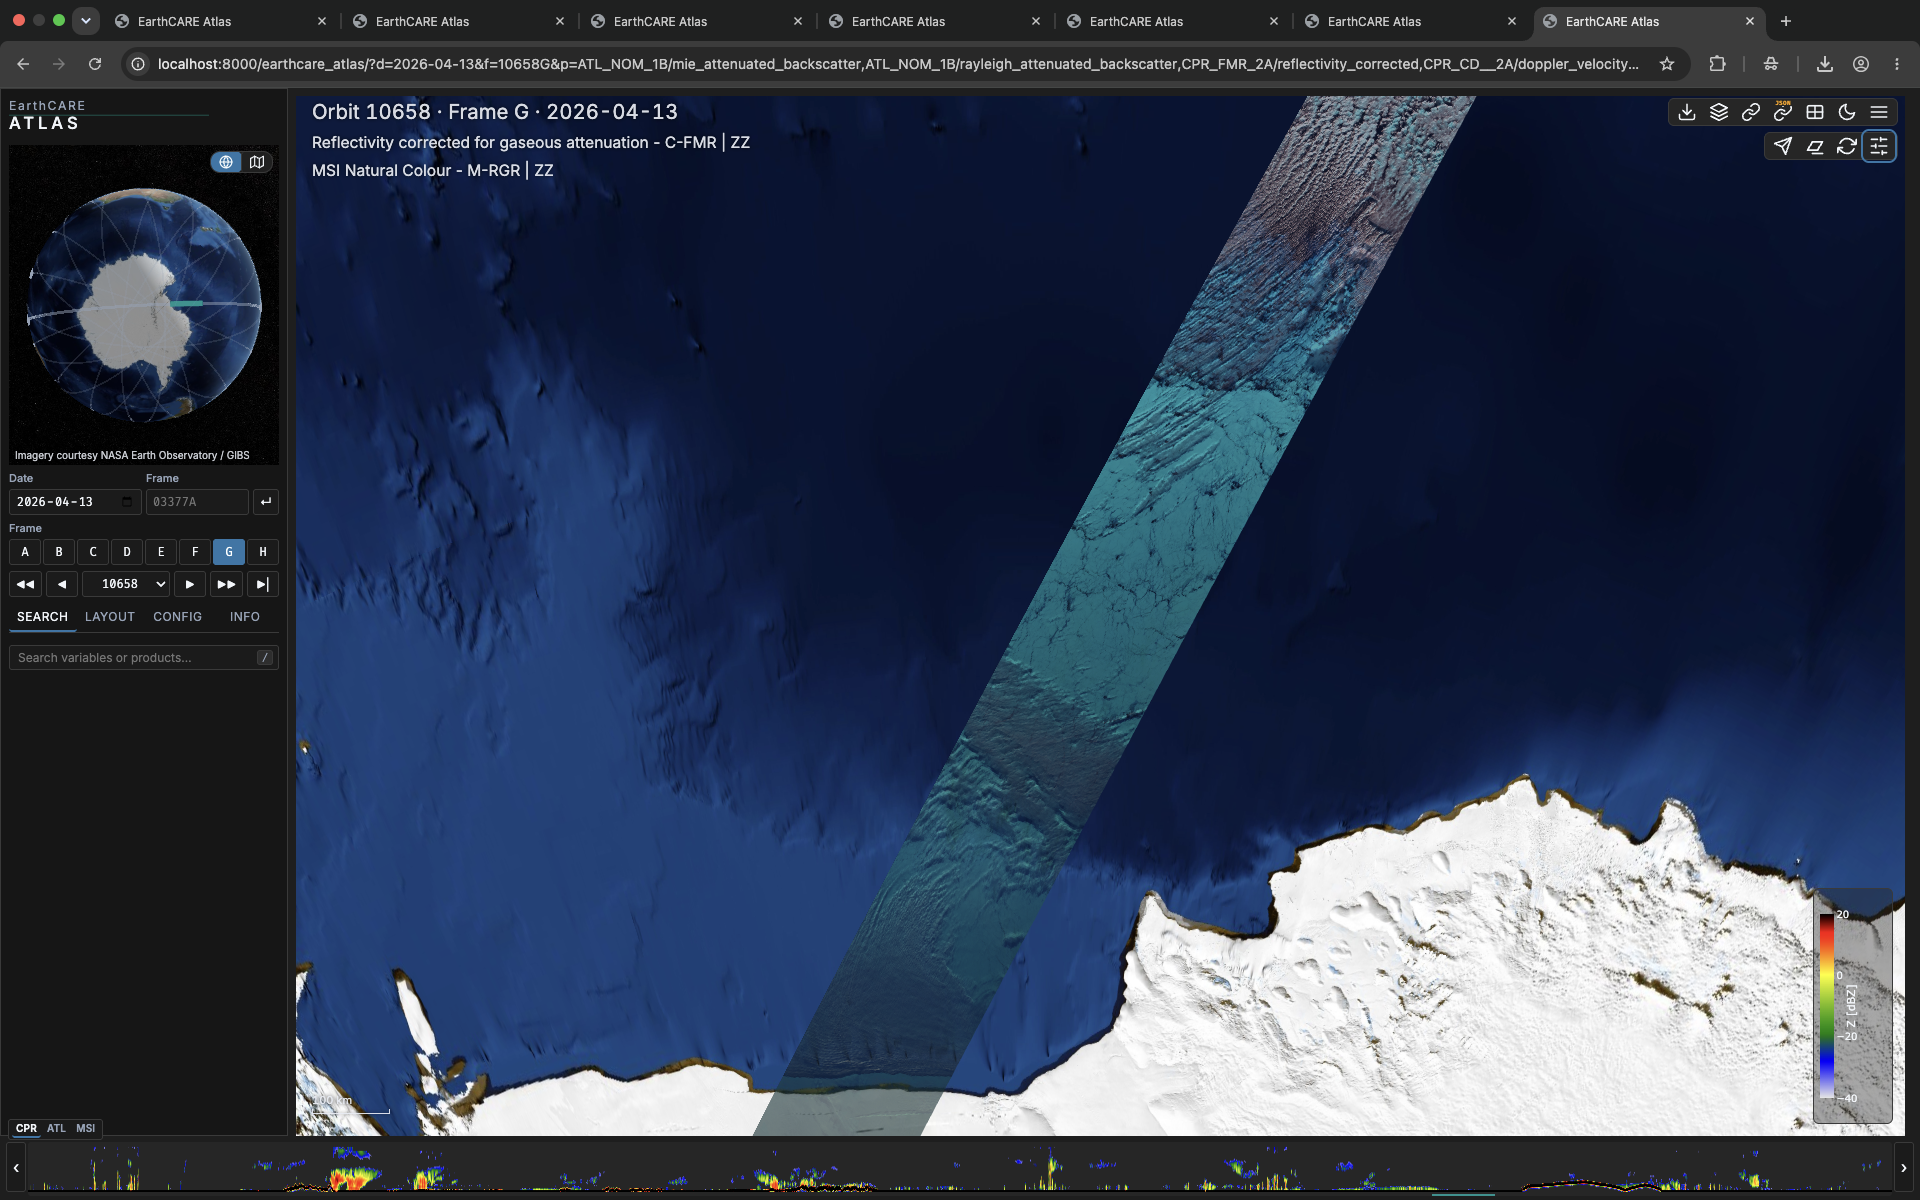
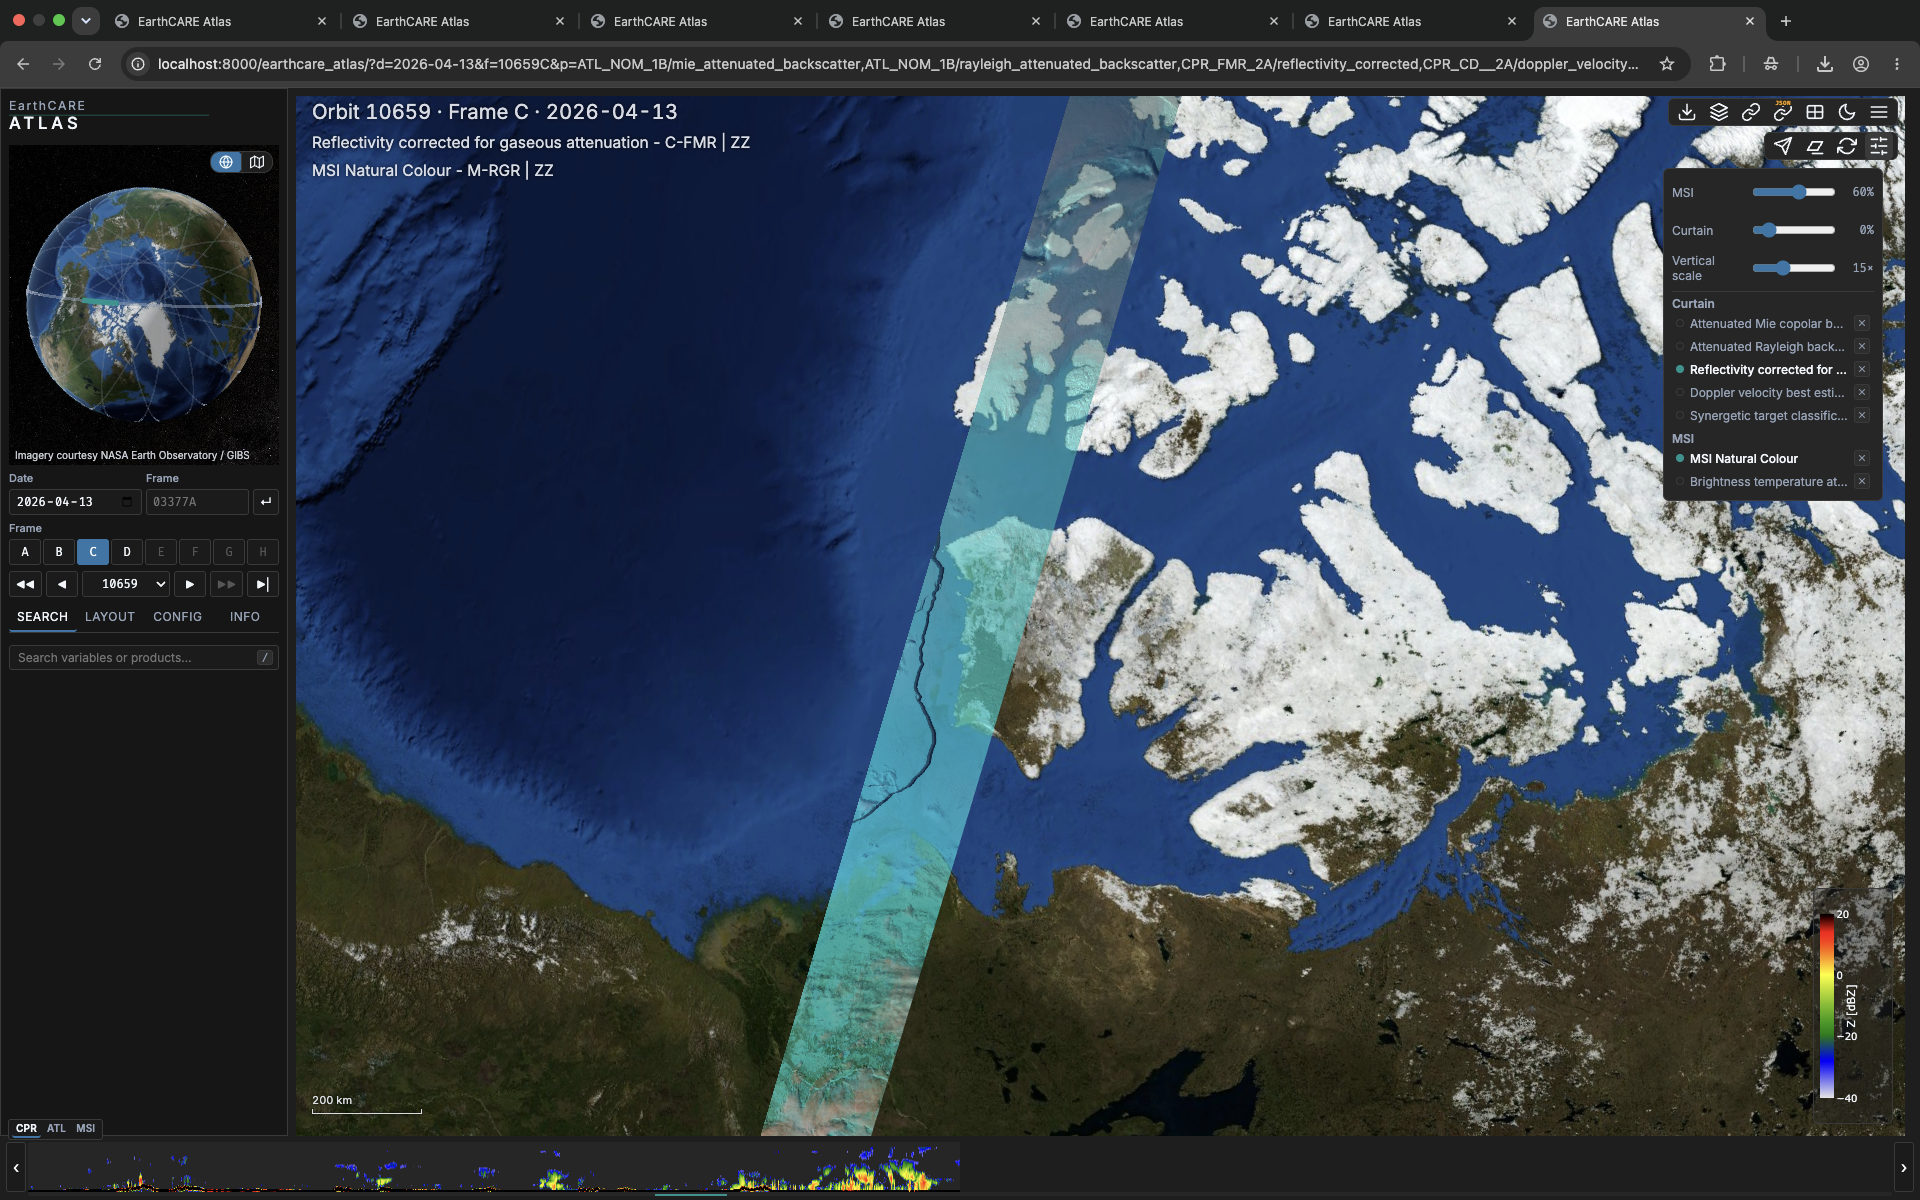
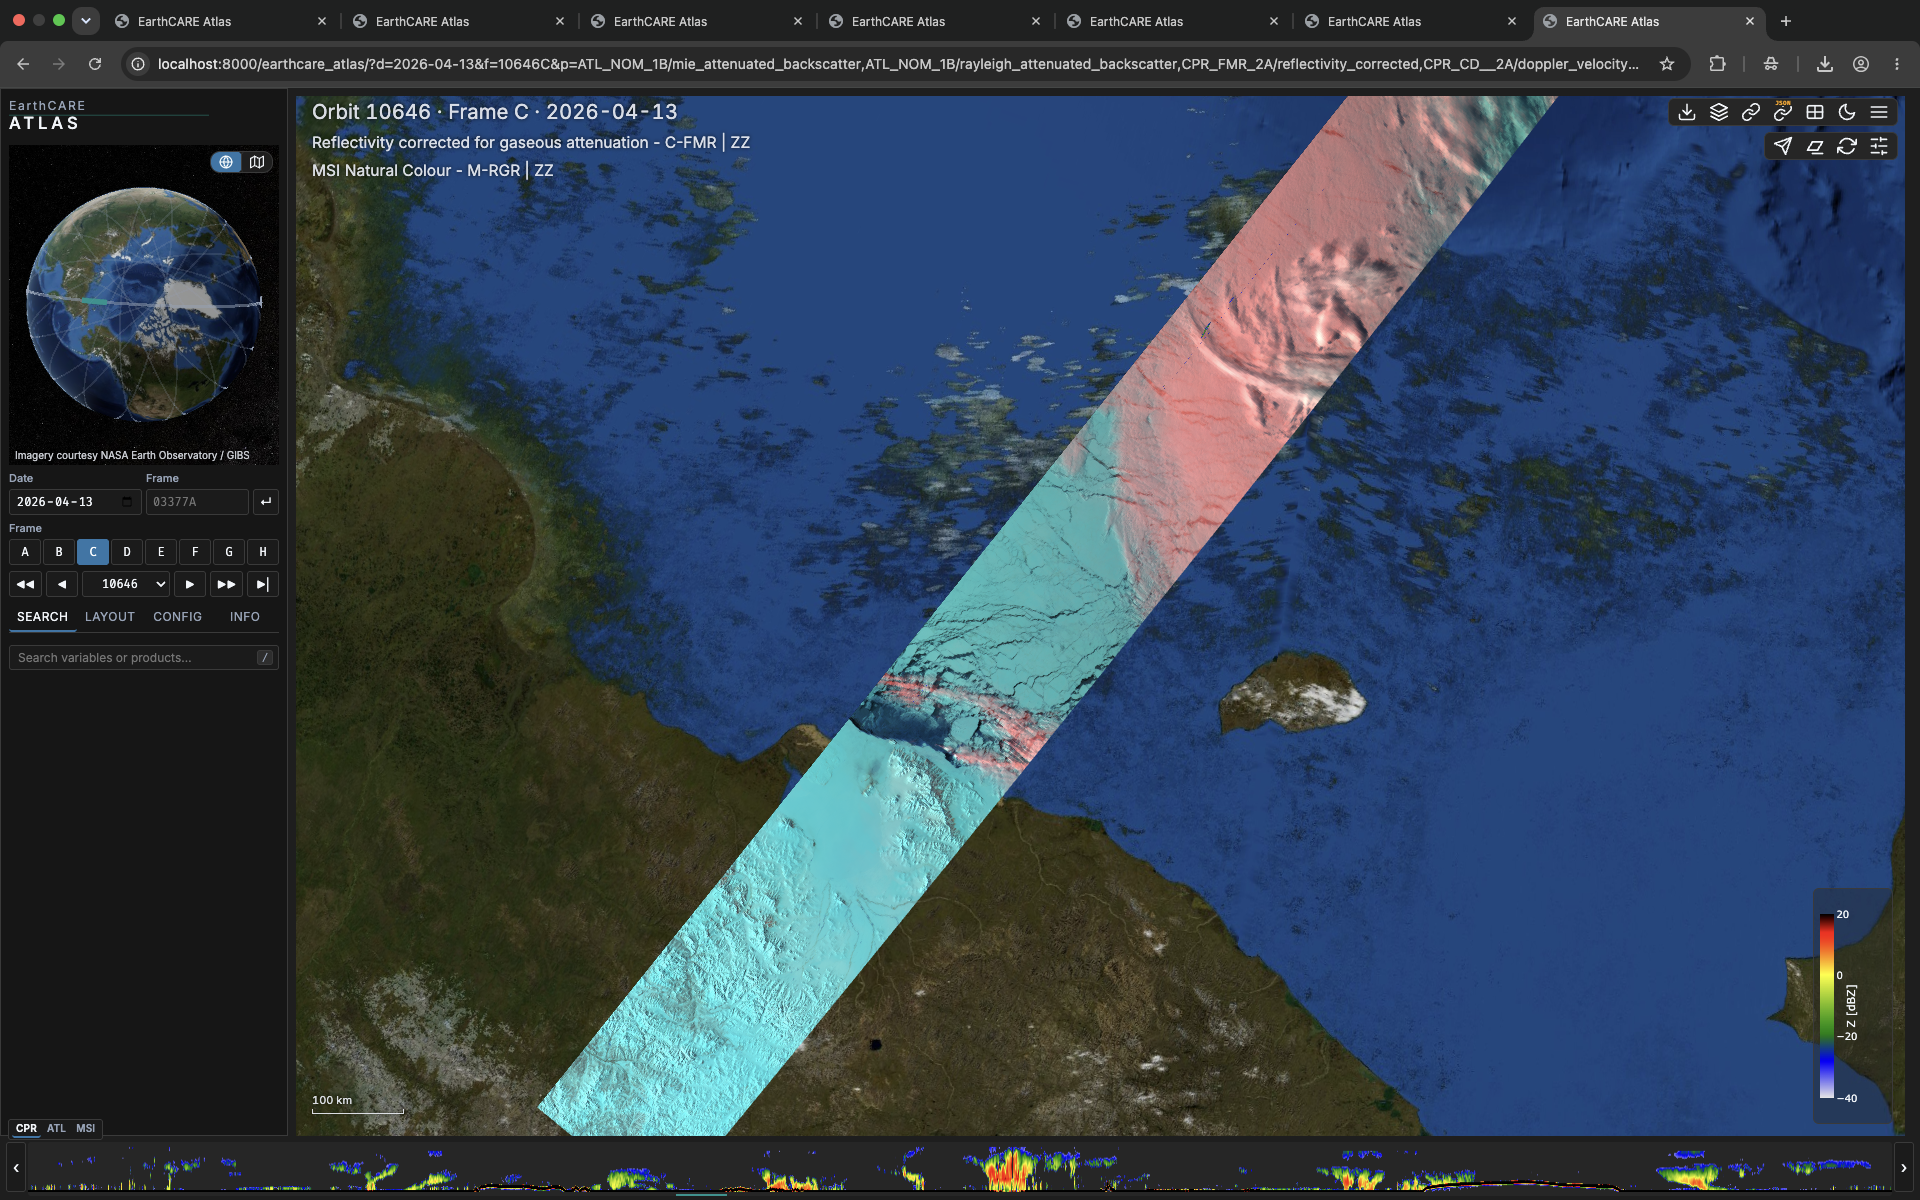
Sea Ice
Polar orbits over the ice edge — surface, clouds and precipitation in a single view.
Phenomena
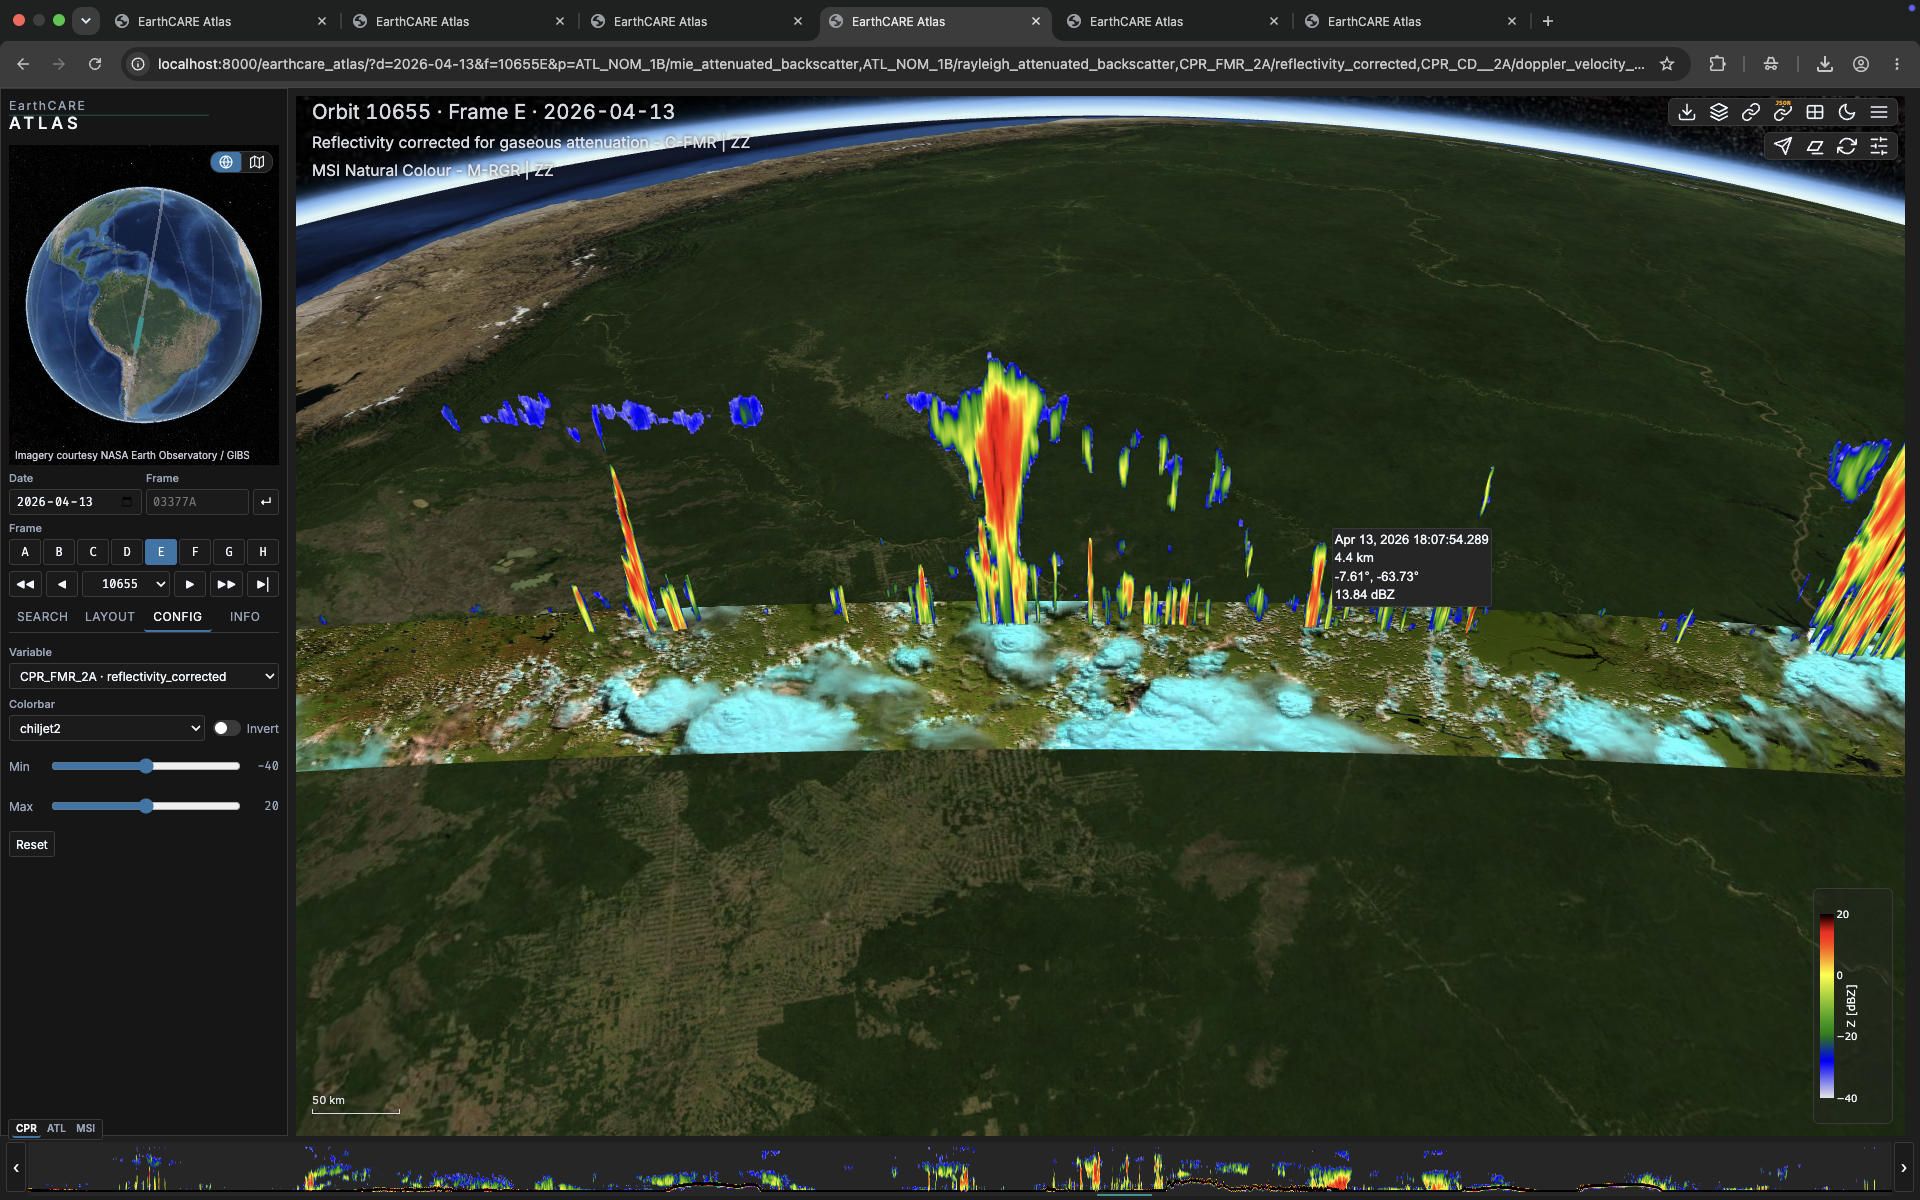
Amazon Rainforest
Moist tropical convection and aerosol above the world's largest rainforest.
 ↑ Top
↑ Top
Phenomena
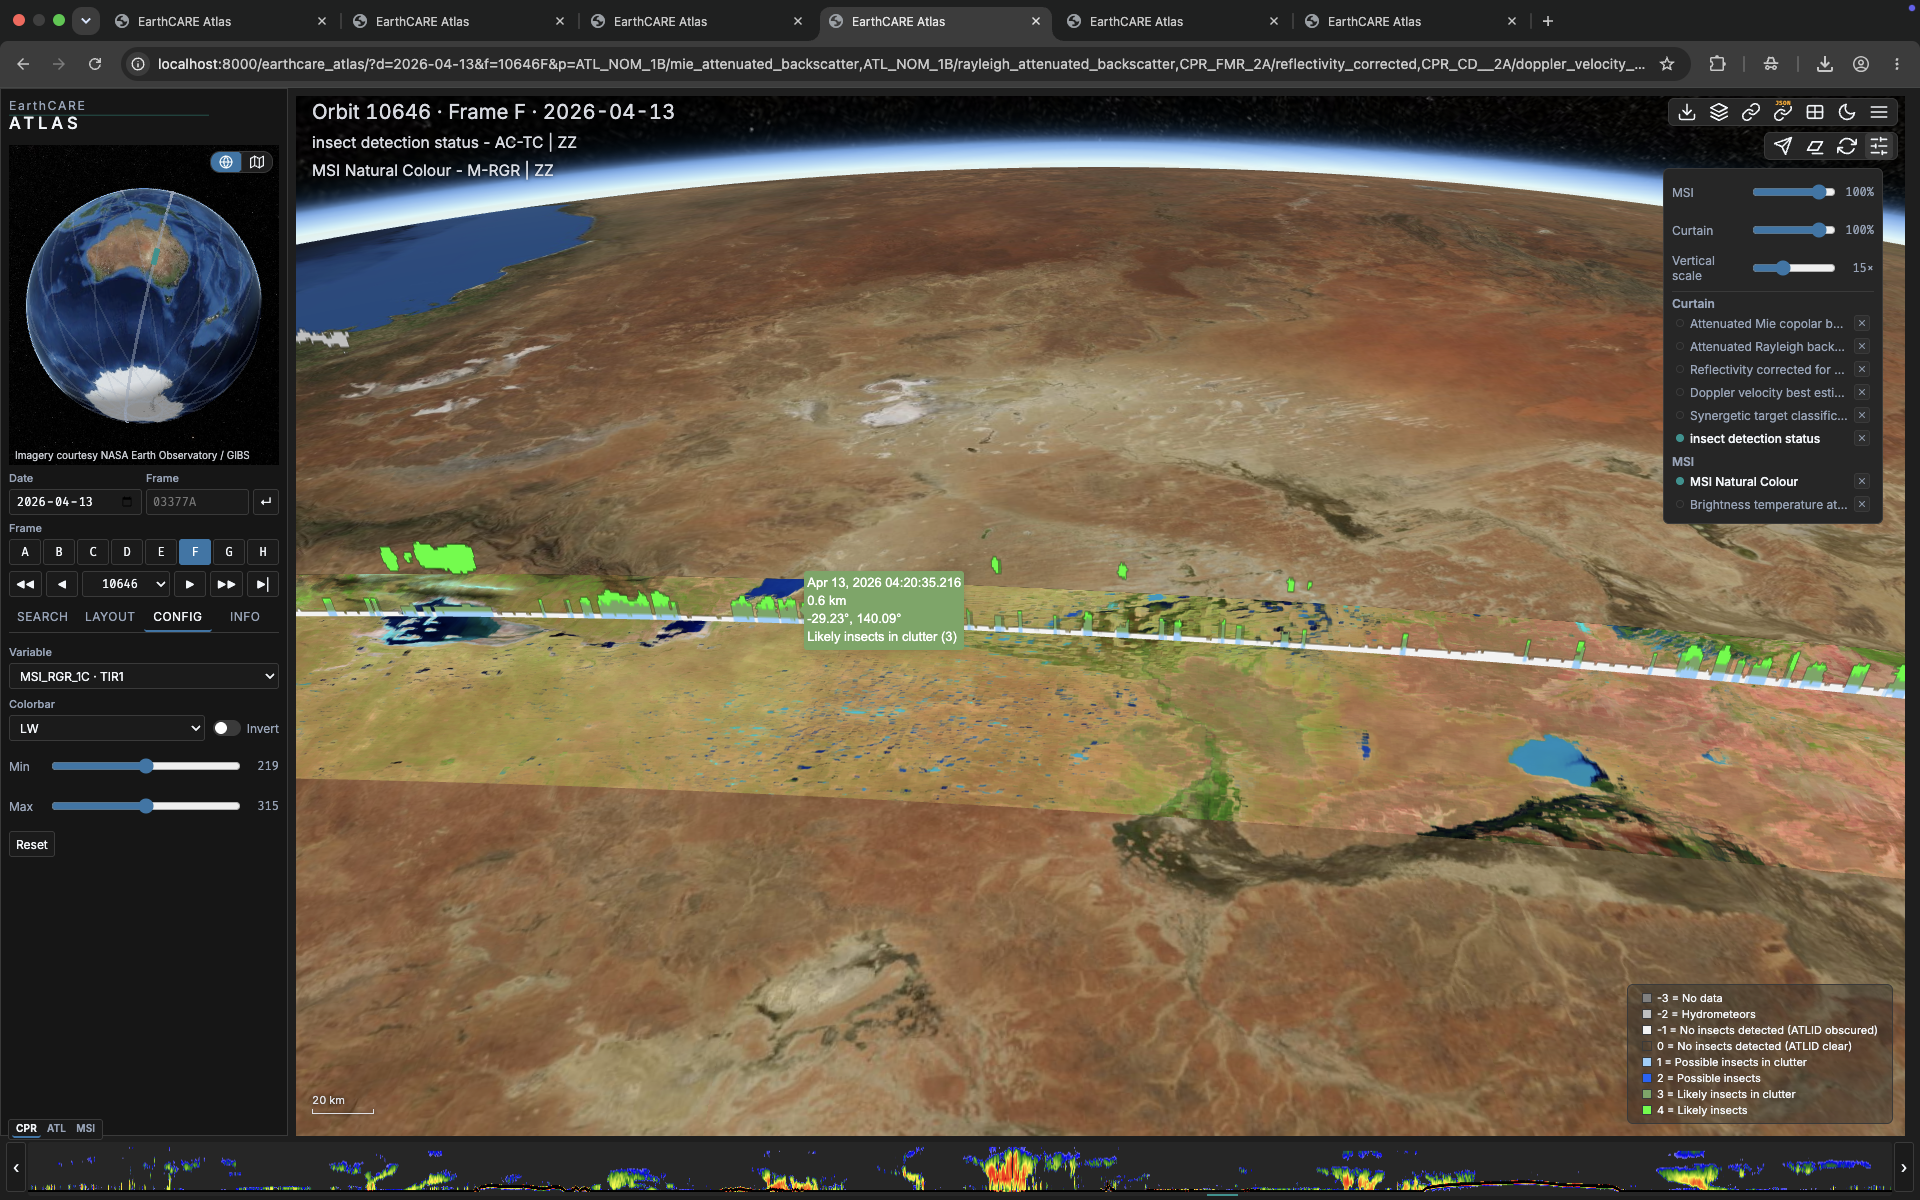
Insect Detection
Not every echo is a cloud — biological scatterers fill the boundary layer over land.
 ↑ Top
↑ Top
Products & science
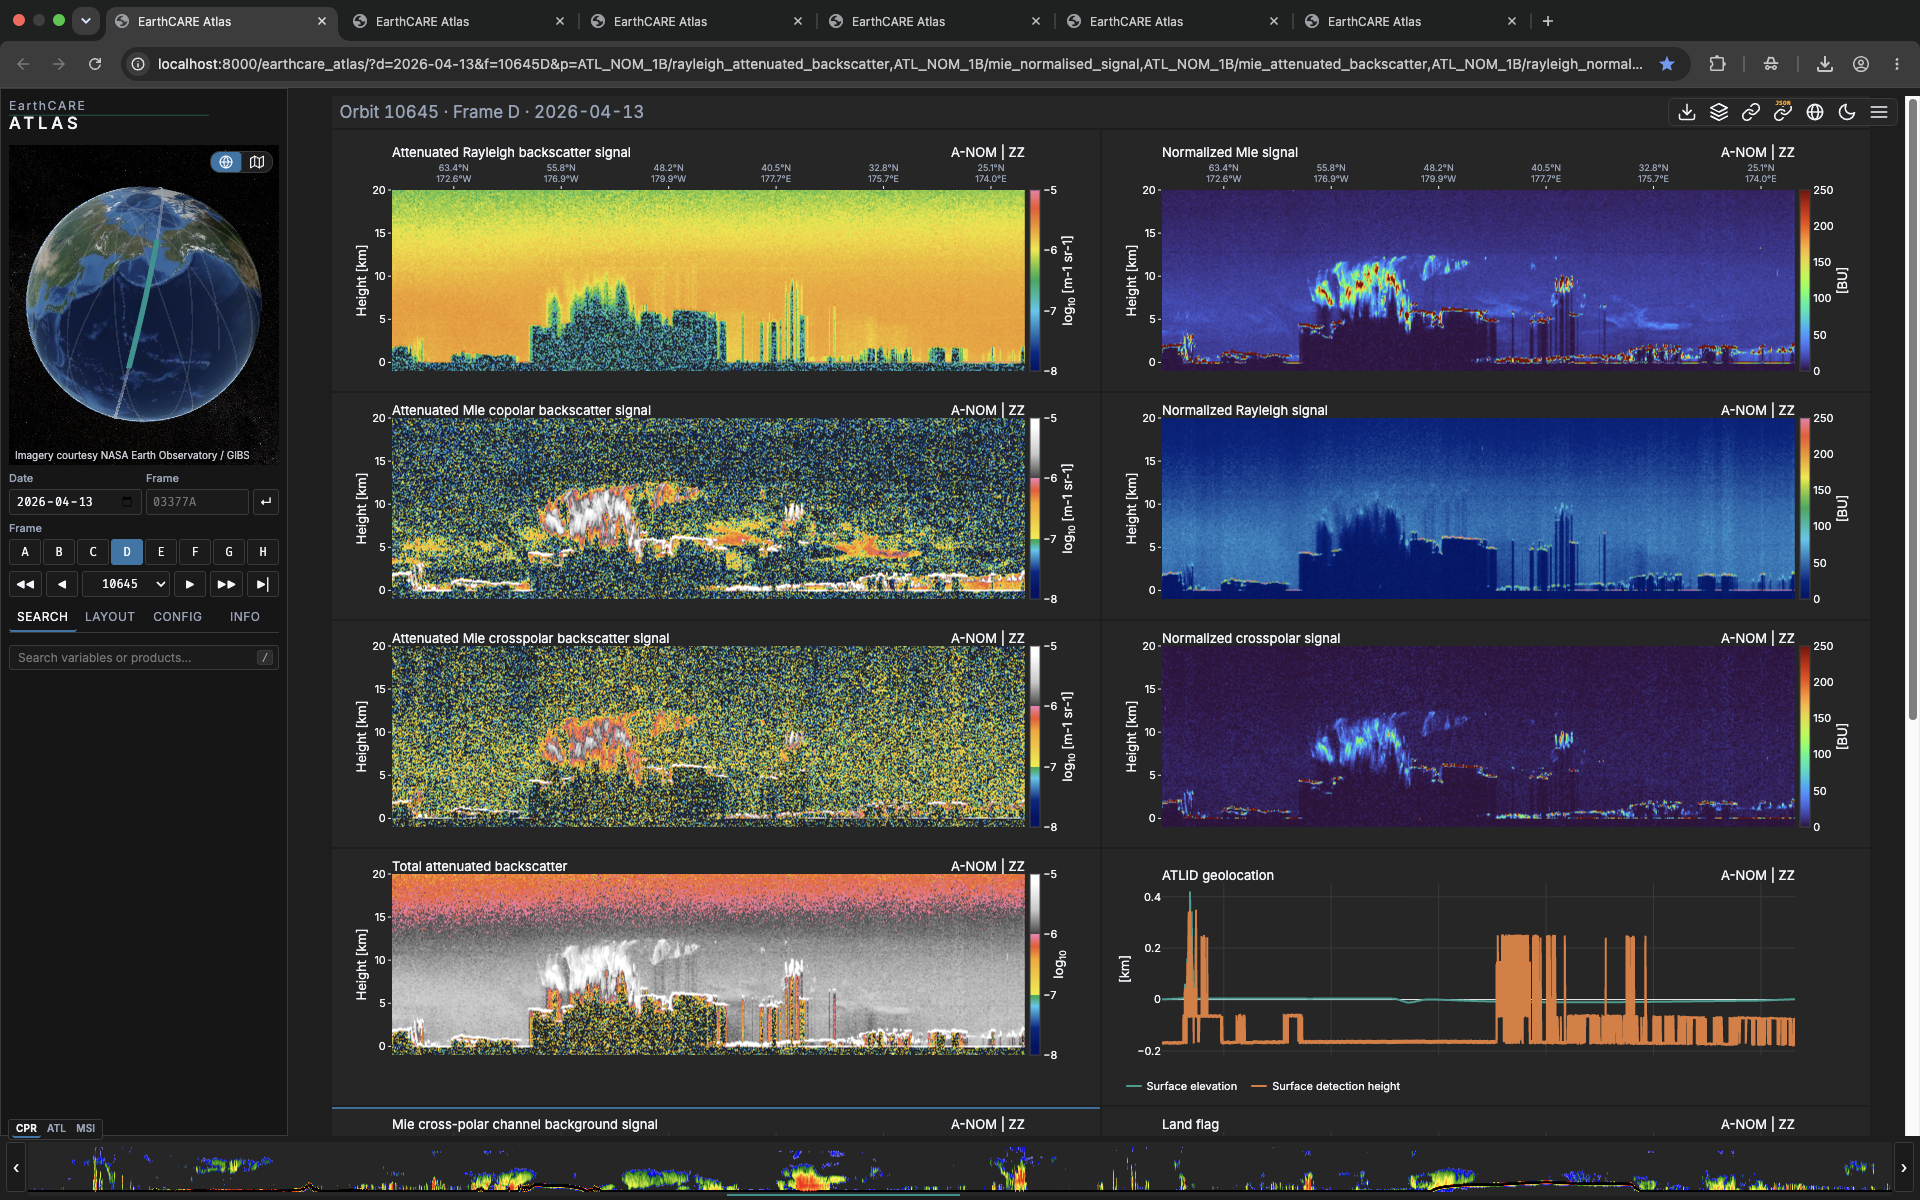
ATLID L1b
Raw attenuated backscatter from the atmospheric lidar, straight from Level 1b.
 ↑ Top
↑ Top
Products & science
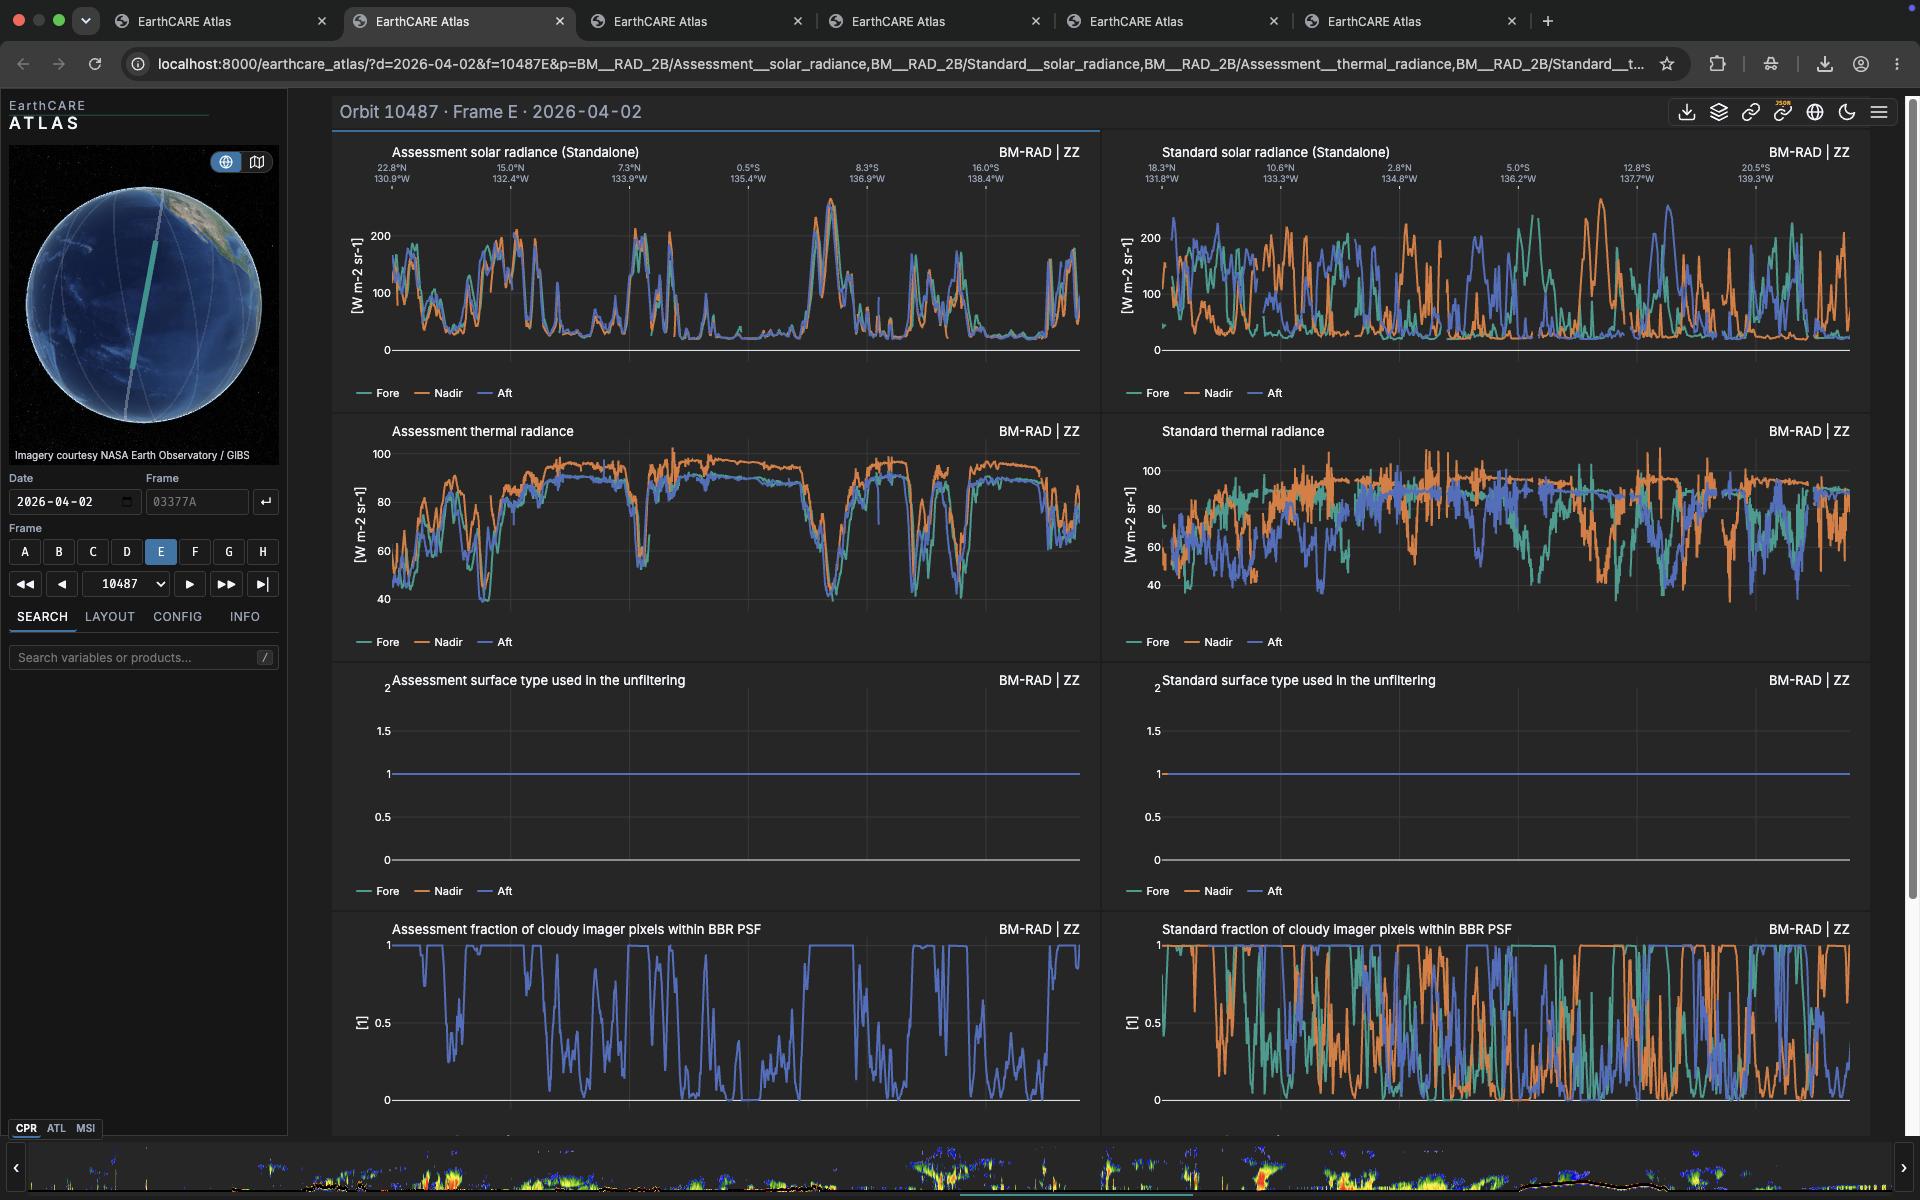
Broadband Radiometer
Top-of-atmosphere radiative fluxes alongside the profiles that explain them.
 ↑ Top
↑ Top
Products & science
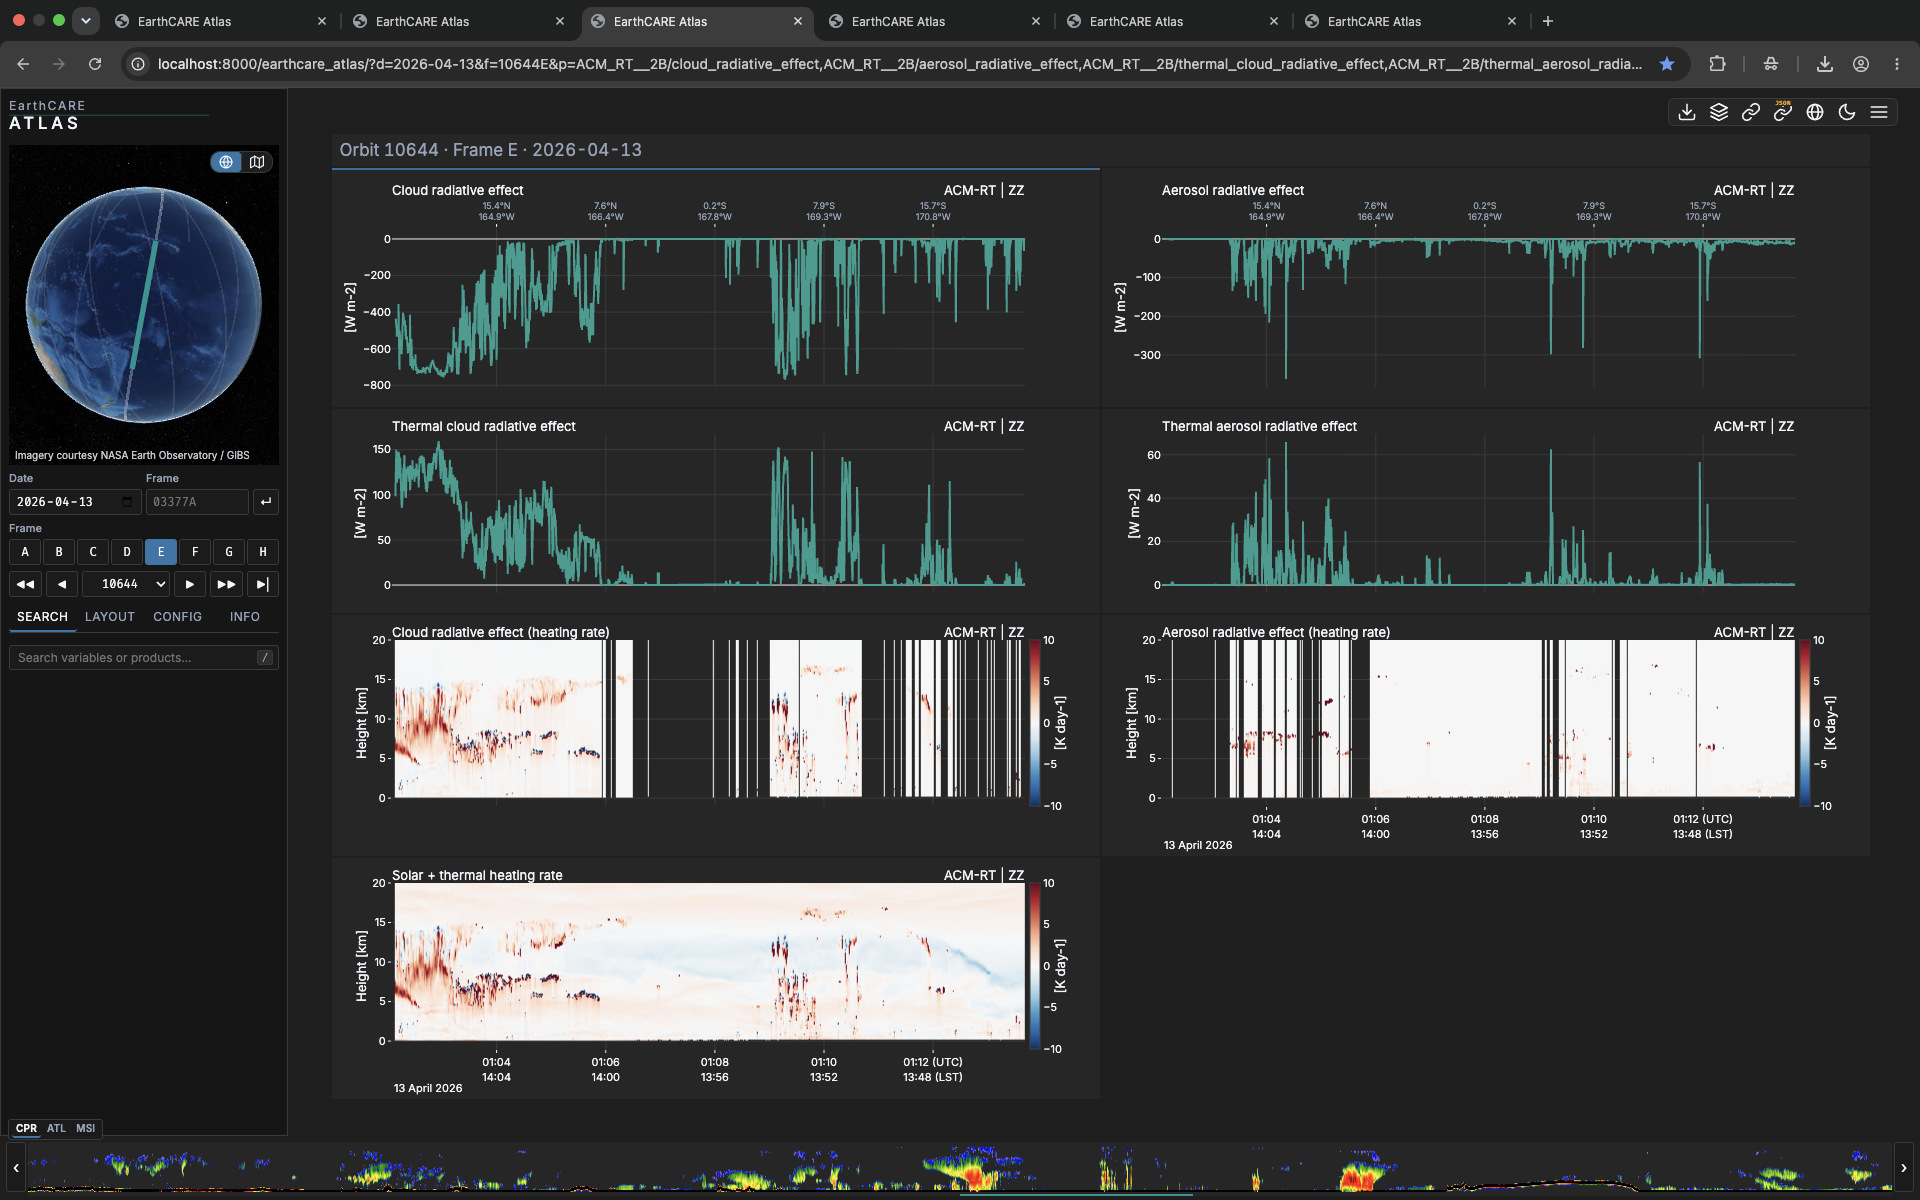
Cloud Radiative Effects
How much do clouds warm or cool the column? Radiative effects, profile by profile.
 ↑ Top
↑ Top
Products & science
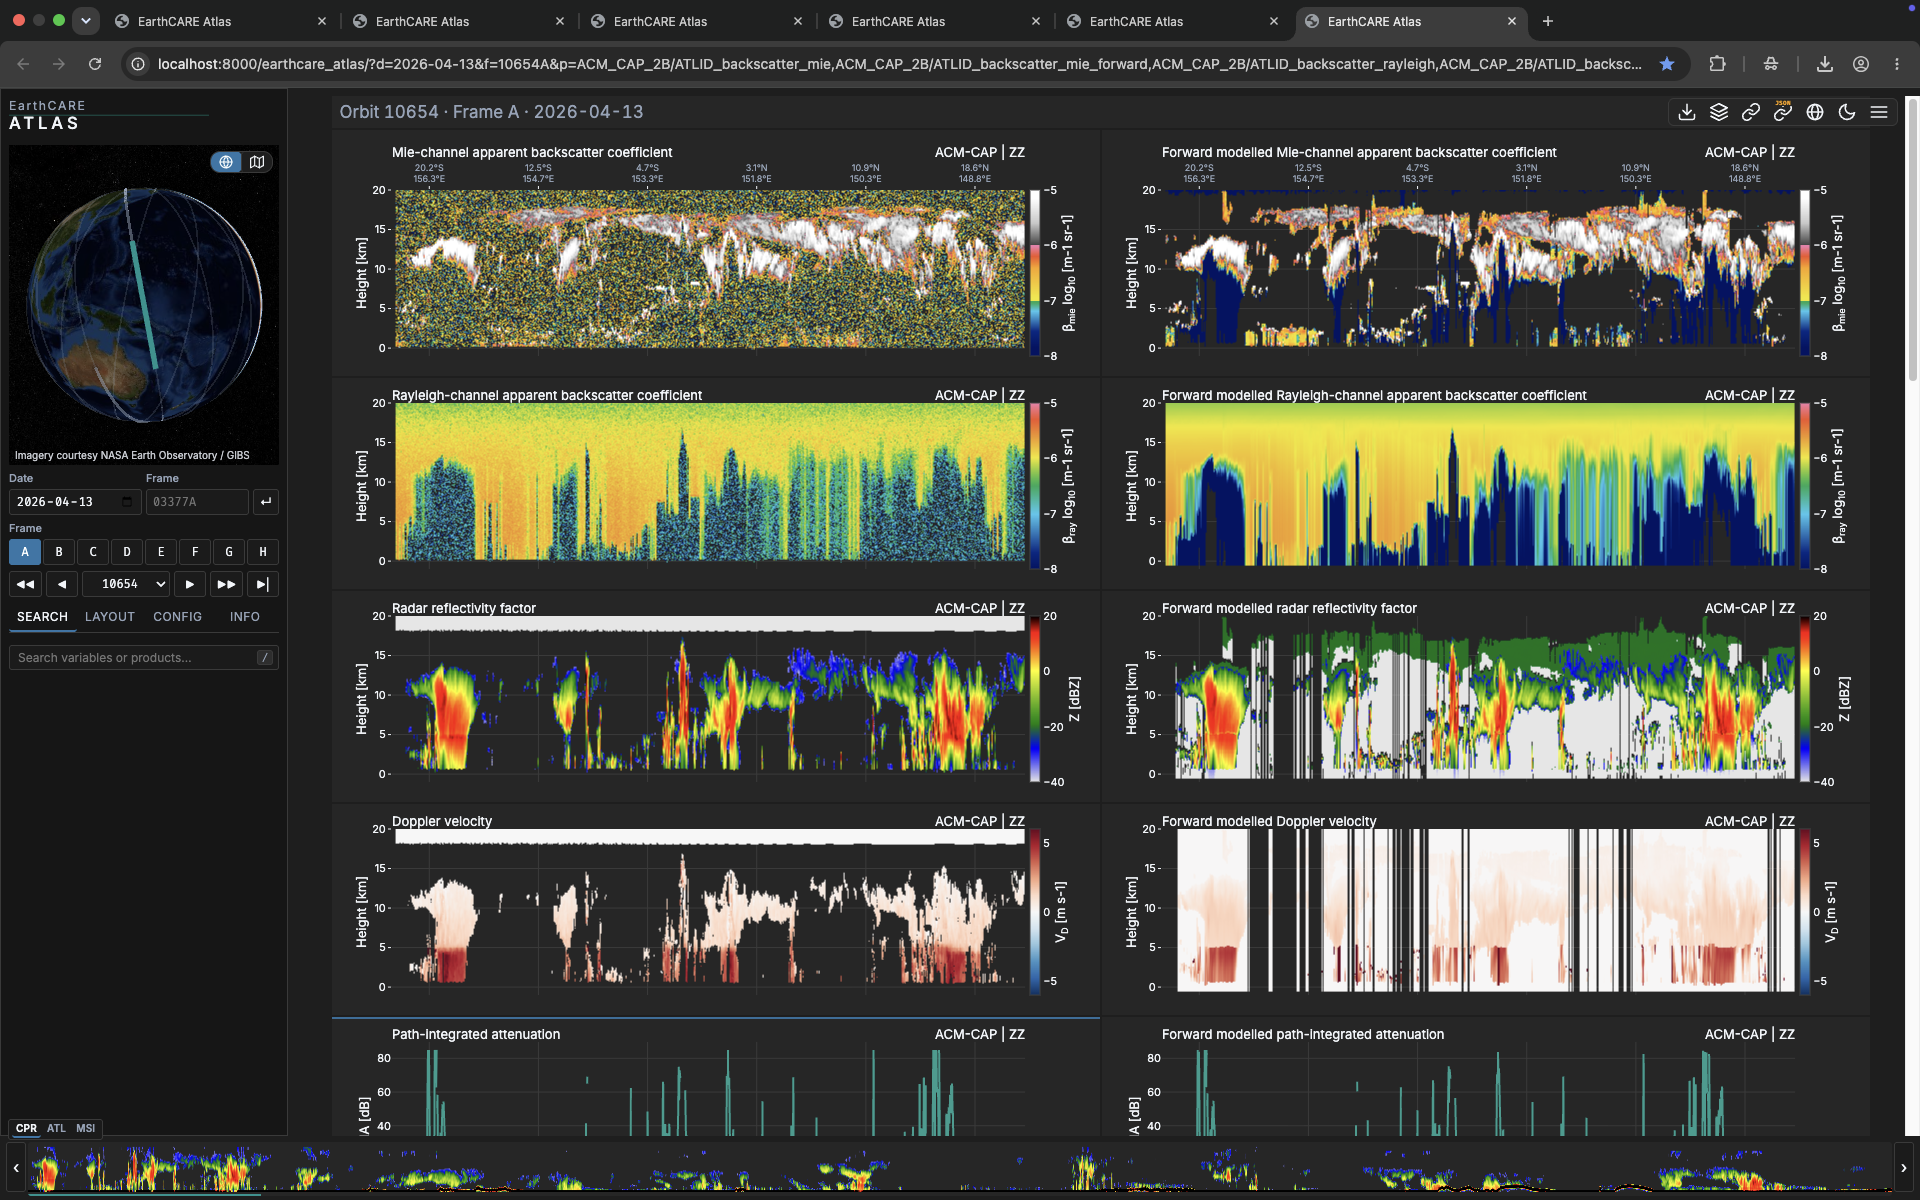
Synergistic Retrievals
Radar, lidar and imager combined — the synergy products at full resolution.
 ↑ Top
↑ Top
Products & science
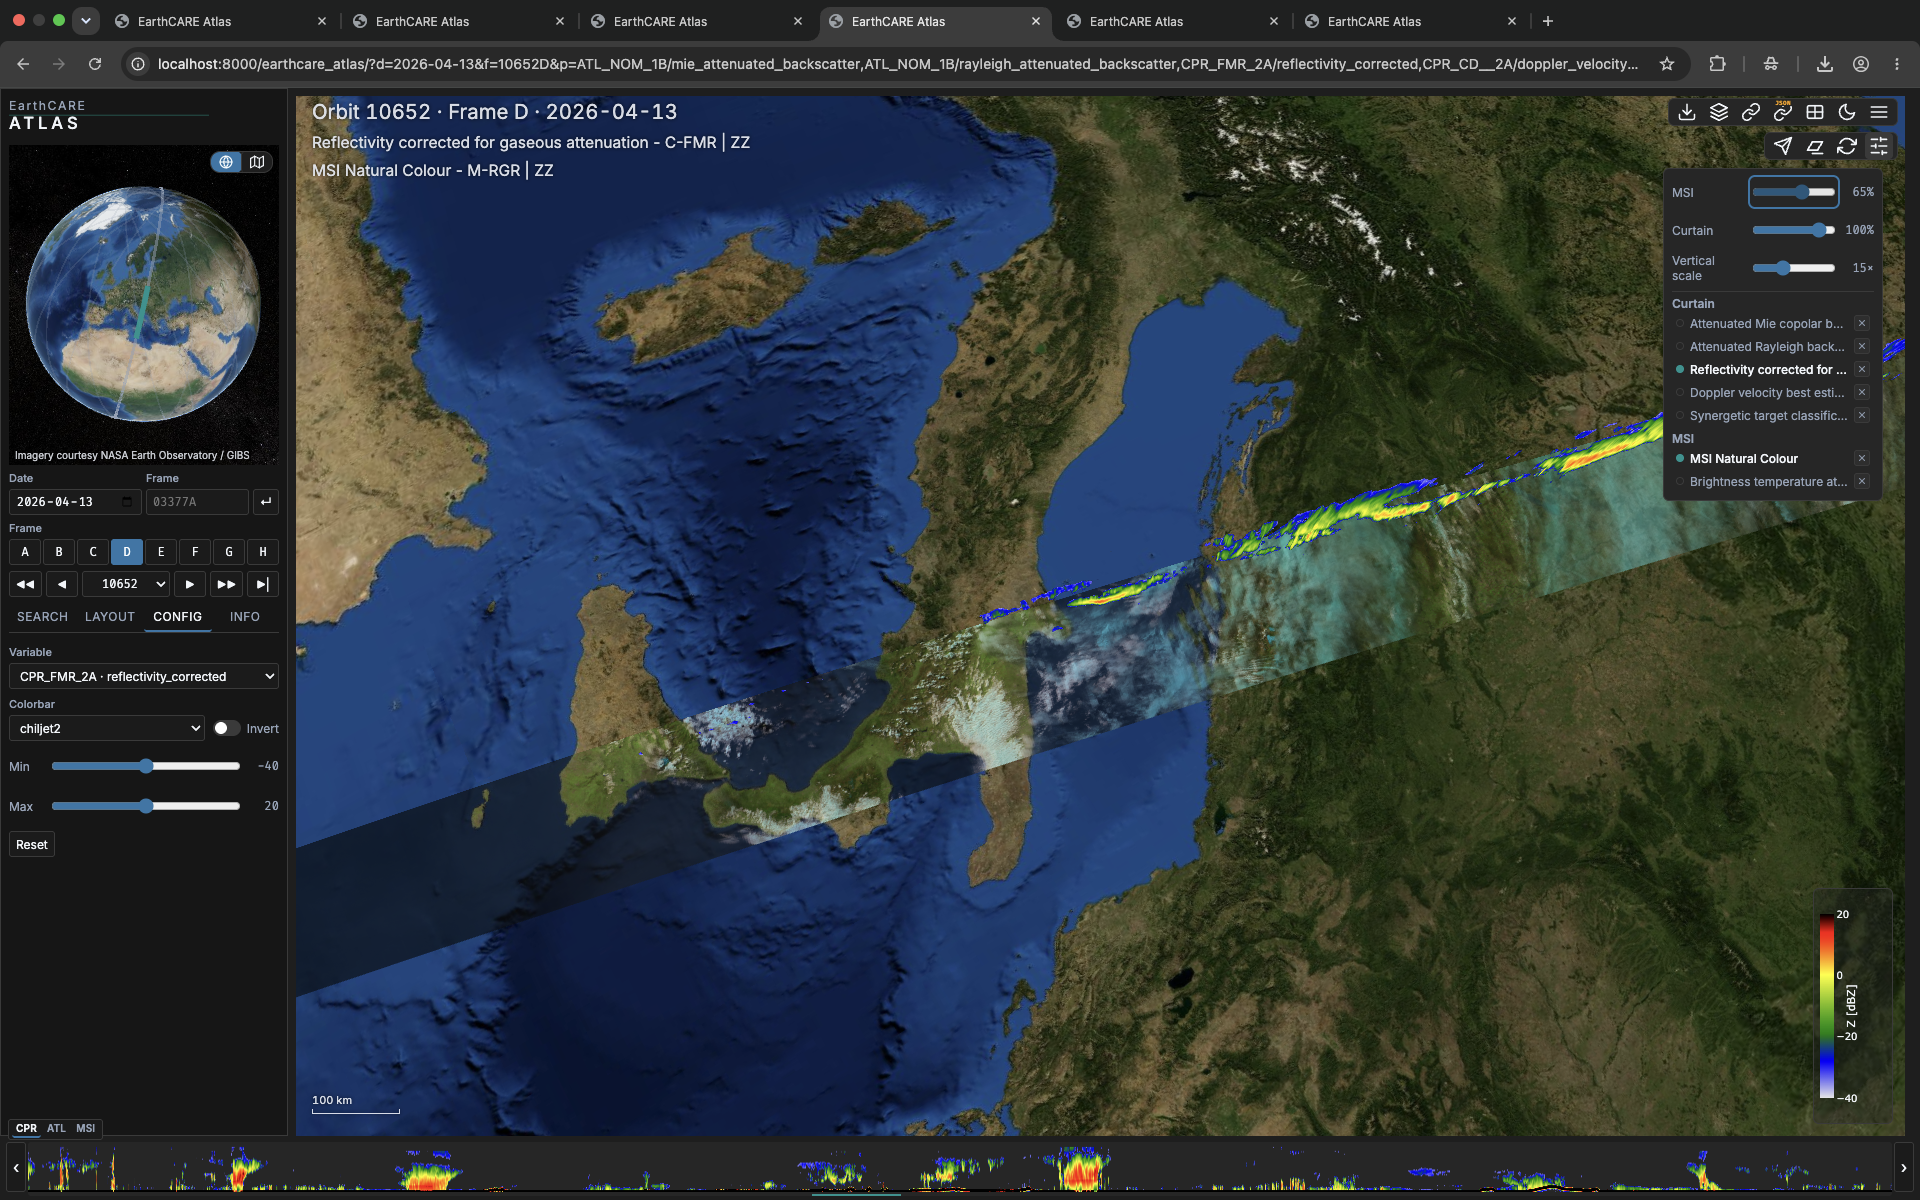
Geolocation
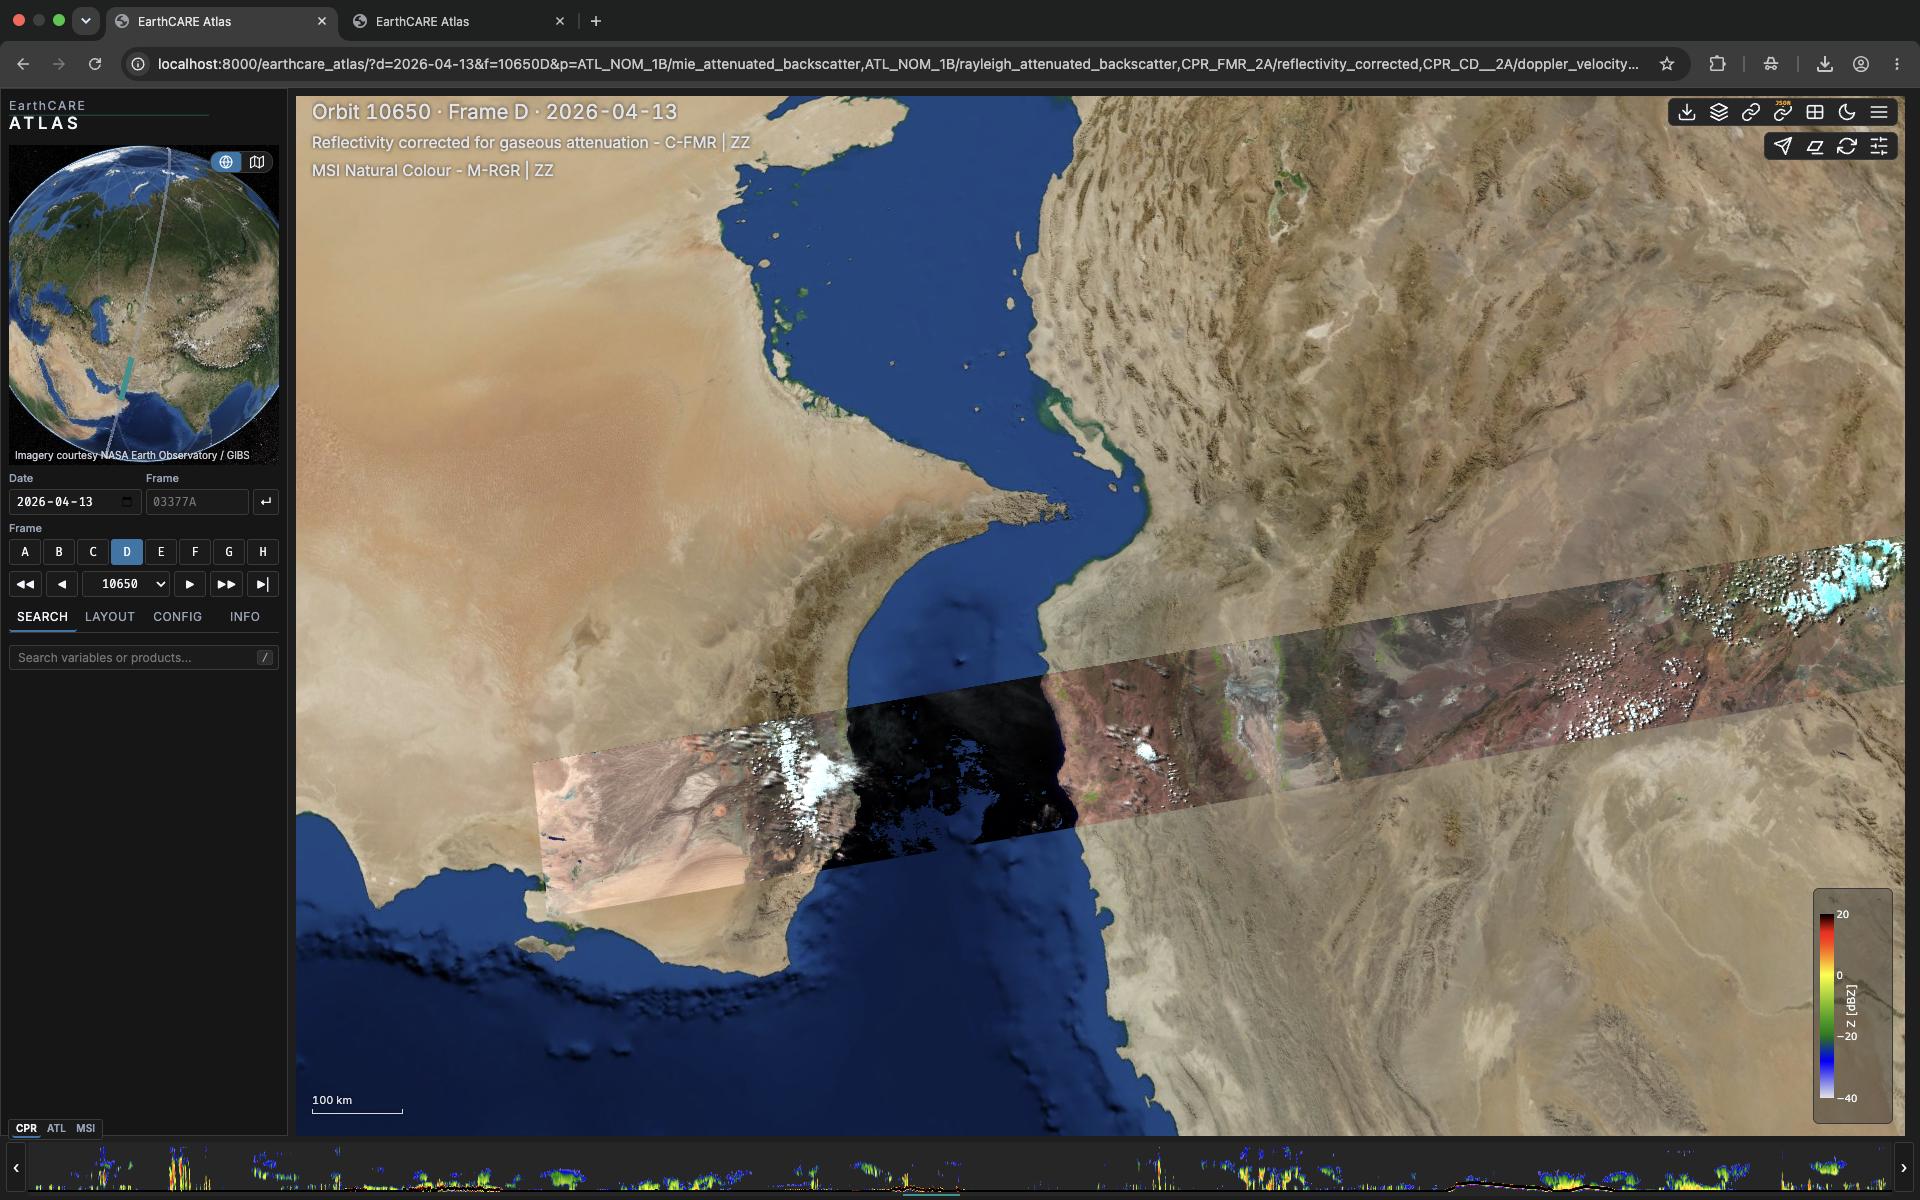
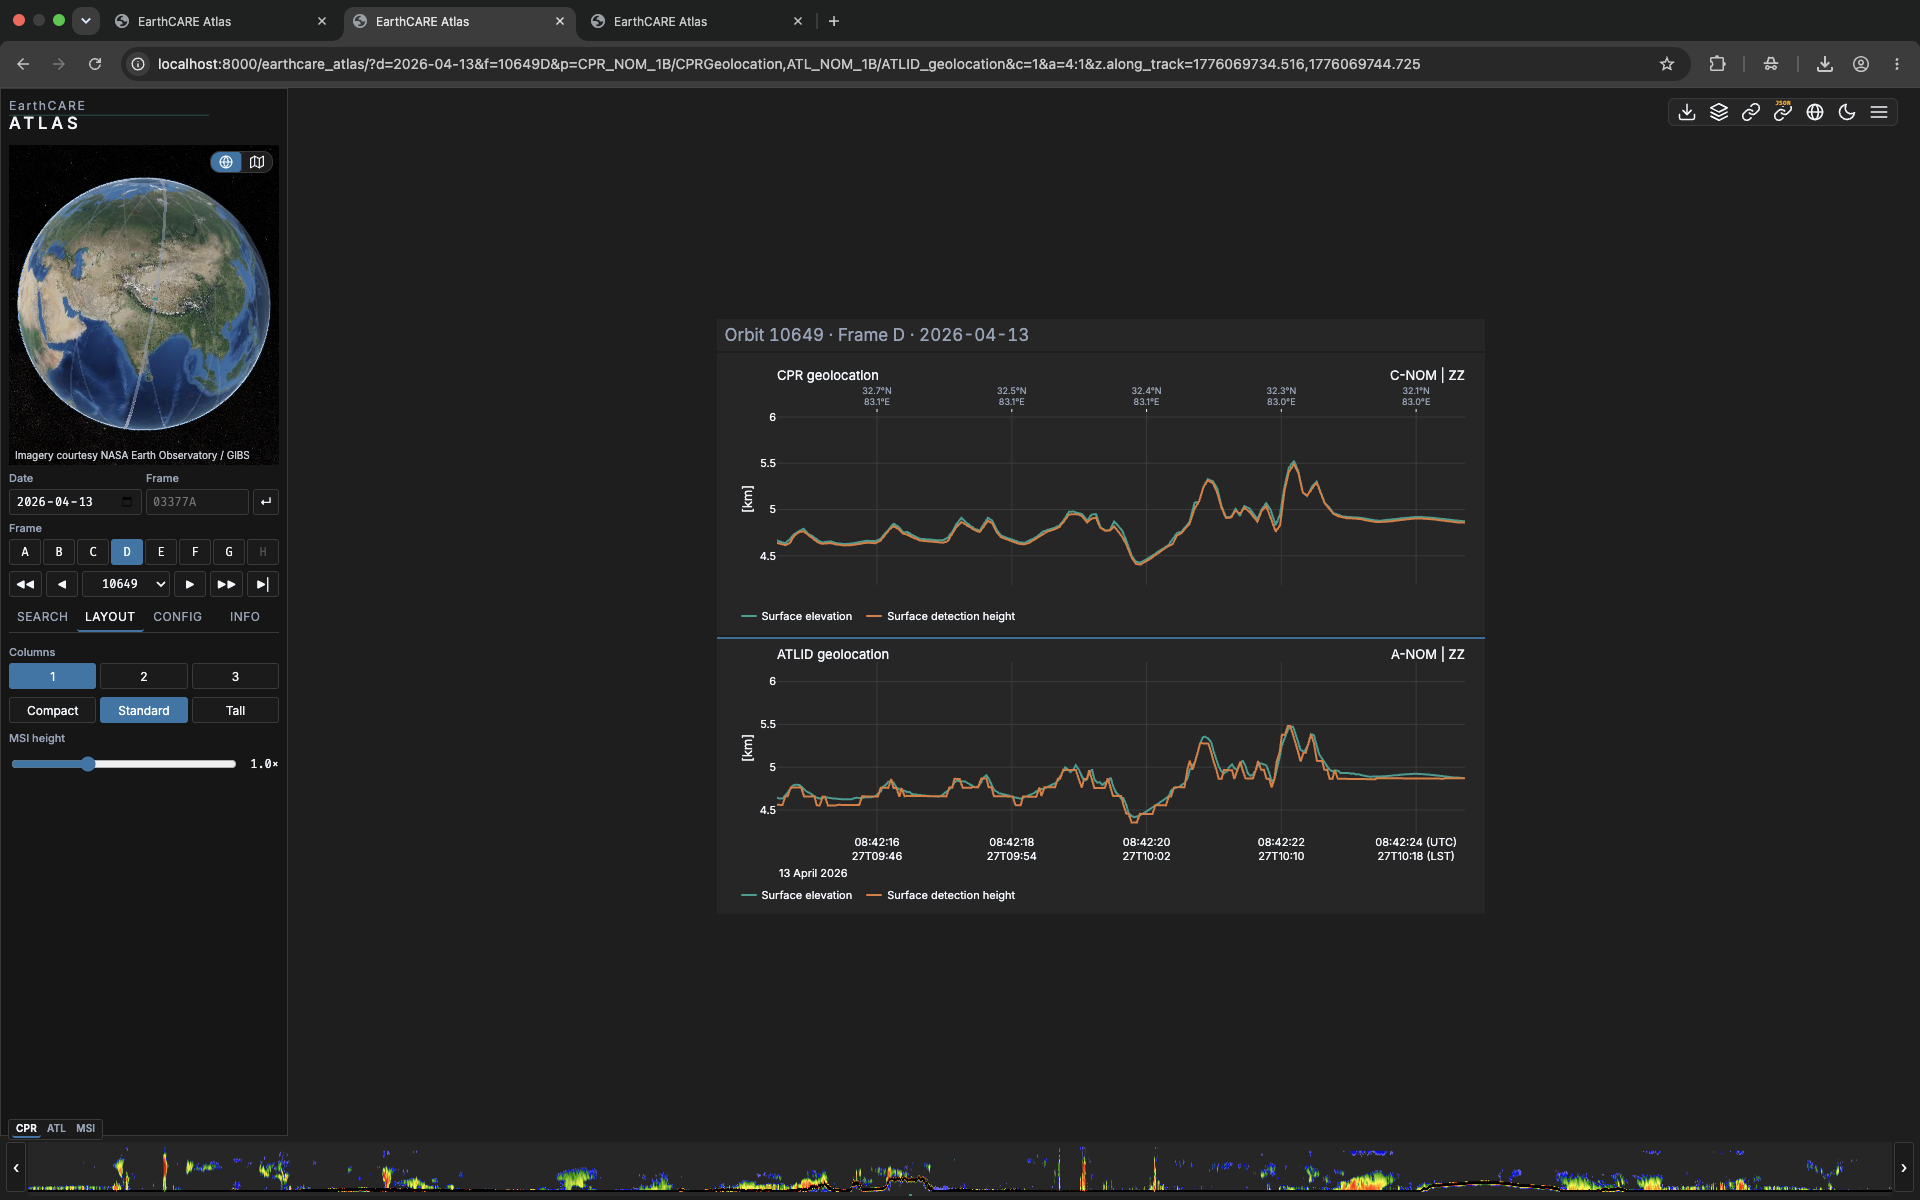
Every pixel georeferenced — follow the exact ground track of each measurement on the globe.
Workflow
Presentation-Ready Exports
Every view exports as a publication-quality visual in one click — from exploration to presentation slide in seconds.